

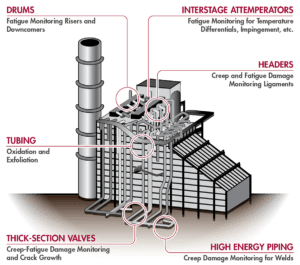
Figure 1. Typical components that are monitored with the pertinent damage mechanisms in mind.
A CASE STUDY ON IMPLEMENTATION AT A 3X1 COMBINED CYCLE FACILITY (ARTICLE 1 OF 3)
By: Kane Riggenbach and Ben Ruchte
SI has successfully implemented a real-time, online, damage monitoring system for the Heat Recovery Steam Generators (HRSGs) at a combined cycle plant with a 3×1 configuration (3 HRSGs providing steam to a single steam turbine). The system is configured to quantify and monitor the life limiting effects of creep and fatigue at select locations on each of the HRSGs (e.g. attemperators, headers, and drums – see Figure 1). The brand name for this system is SIIQ™, which exists as a monitoring solution for high energy piping (HEP) systems and/or HRSG pressure-part components. SIIQ™ utilizes off-the-shelf sensors (e.g. surface-mounted thermocouples) and existing instrumentation (e.g. thermowells, pressure taps, flow transmitters, etc.) via secure access to the data historian. The incorporation of this data into SI’s damage accumulation algorithms generates results that are then displayed within the online monitoring module of SI’s PlantTrack™ data management system (example of the dashboard display shown in Figure 2).

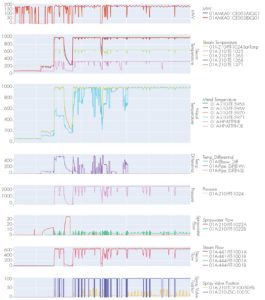
Figure 2. Example dashboard of the health status and ‘action’ date for a variety of components.
This article will be part of a series discussing items such as the background for monitoring, implementation/monitoring location selection, and future results for the 3×1 combined cycle plant.
 BASIS FOR MONITORING
The owner of the plant implemented the system with the desire of optimizing operations and maintenance expenses by reducing inspections or at least focusing inspections on the highest risk locations. The system has been in place for a few months now and is continuously updating risk ranking of the equipment and ‘action’ intervals. The ‘action’ recommended may be operational review, further analysis, or inspections. This information is now being used to determine the optimum scope of work for the next maintenance outage based on the damage accumulated. Like many combined cycle plants, attemperators are typically a problem area. Through monitoring, however, it can be determined when temperature differential events occur and to what magnitude. Armed with this information aides in root cause investigation but also, if no damage is recorded, may extend the inspection interval.
HRSG DAMAGE TRACKING
Many HRSG systems are susceptible to damage due to high temperatures and pressures as well as fluctuations and imbalances. Attemperators have been a leading cause of damage accumulation (fatigue) through improper design/operation of the spray water stations (Figure 5). In addition, periods of steady operation can result in accumulation of creep damage in header components (Figure 6) and unit cycling increases fatigue and creep-fatigue damage in stub/ terminal tubes and header ligaments (Figure 7). Monitoring the damage allows equipment owners to be proactive in mitigating or avoiding further damage.
Traditionally, periodic nondestructive examinations (NDE) would be used to determine the extent of damage, but in HRSGs this can be challenging due to access restraints and, in the case of the creep strength enhanced ferritic (CSEF) materials such as Grade 91, damage detection sensitivity is somewhat limited until near end of life. Continuous online monitoring and calculations of damage based on unit-specific finite element (FE) models (sometimes referred to as a ‘digital twin’) with live data addresses this issue.
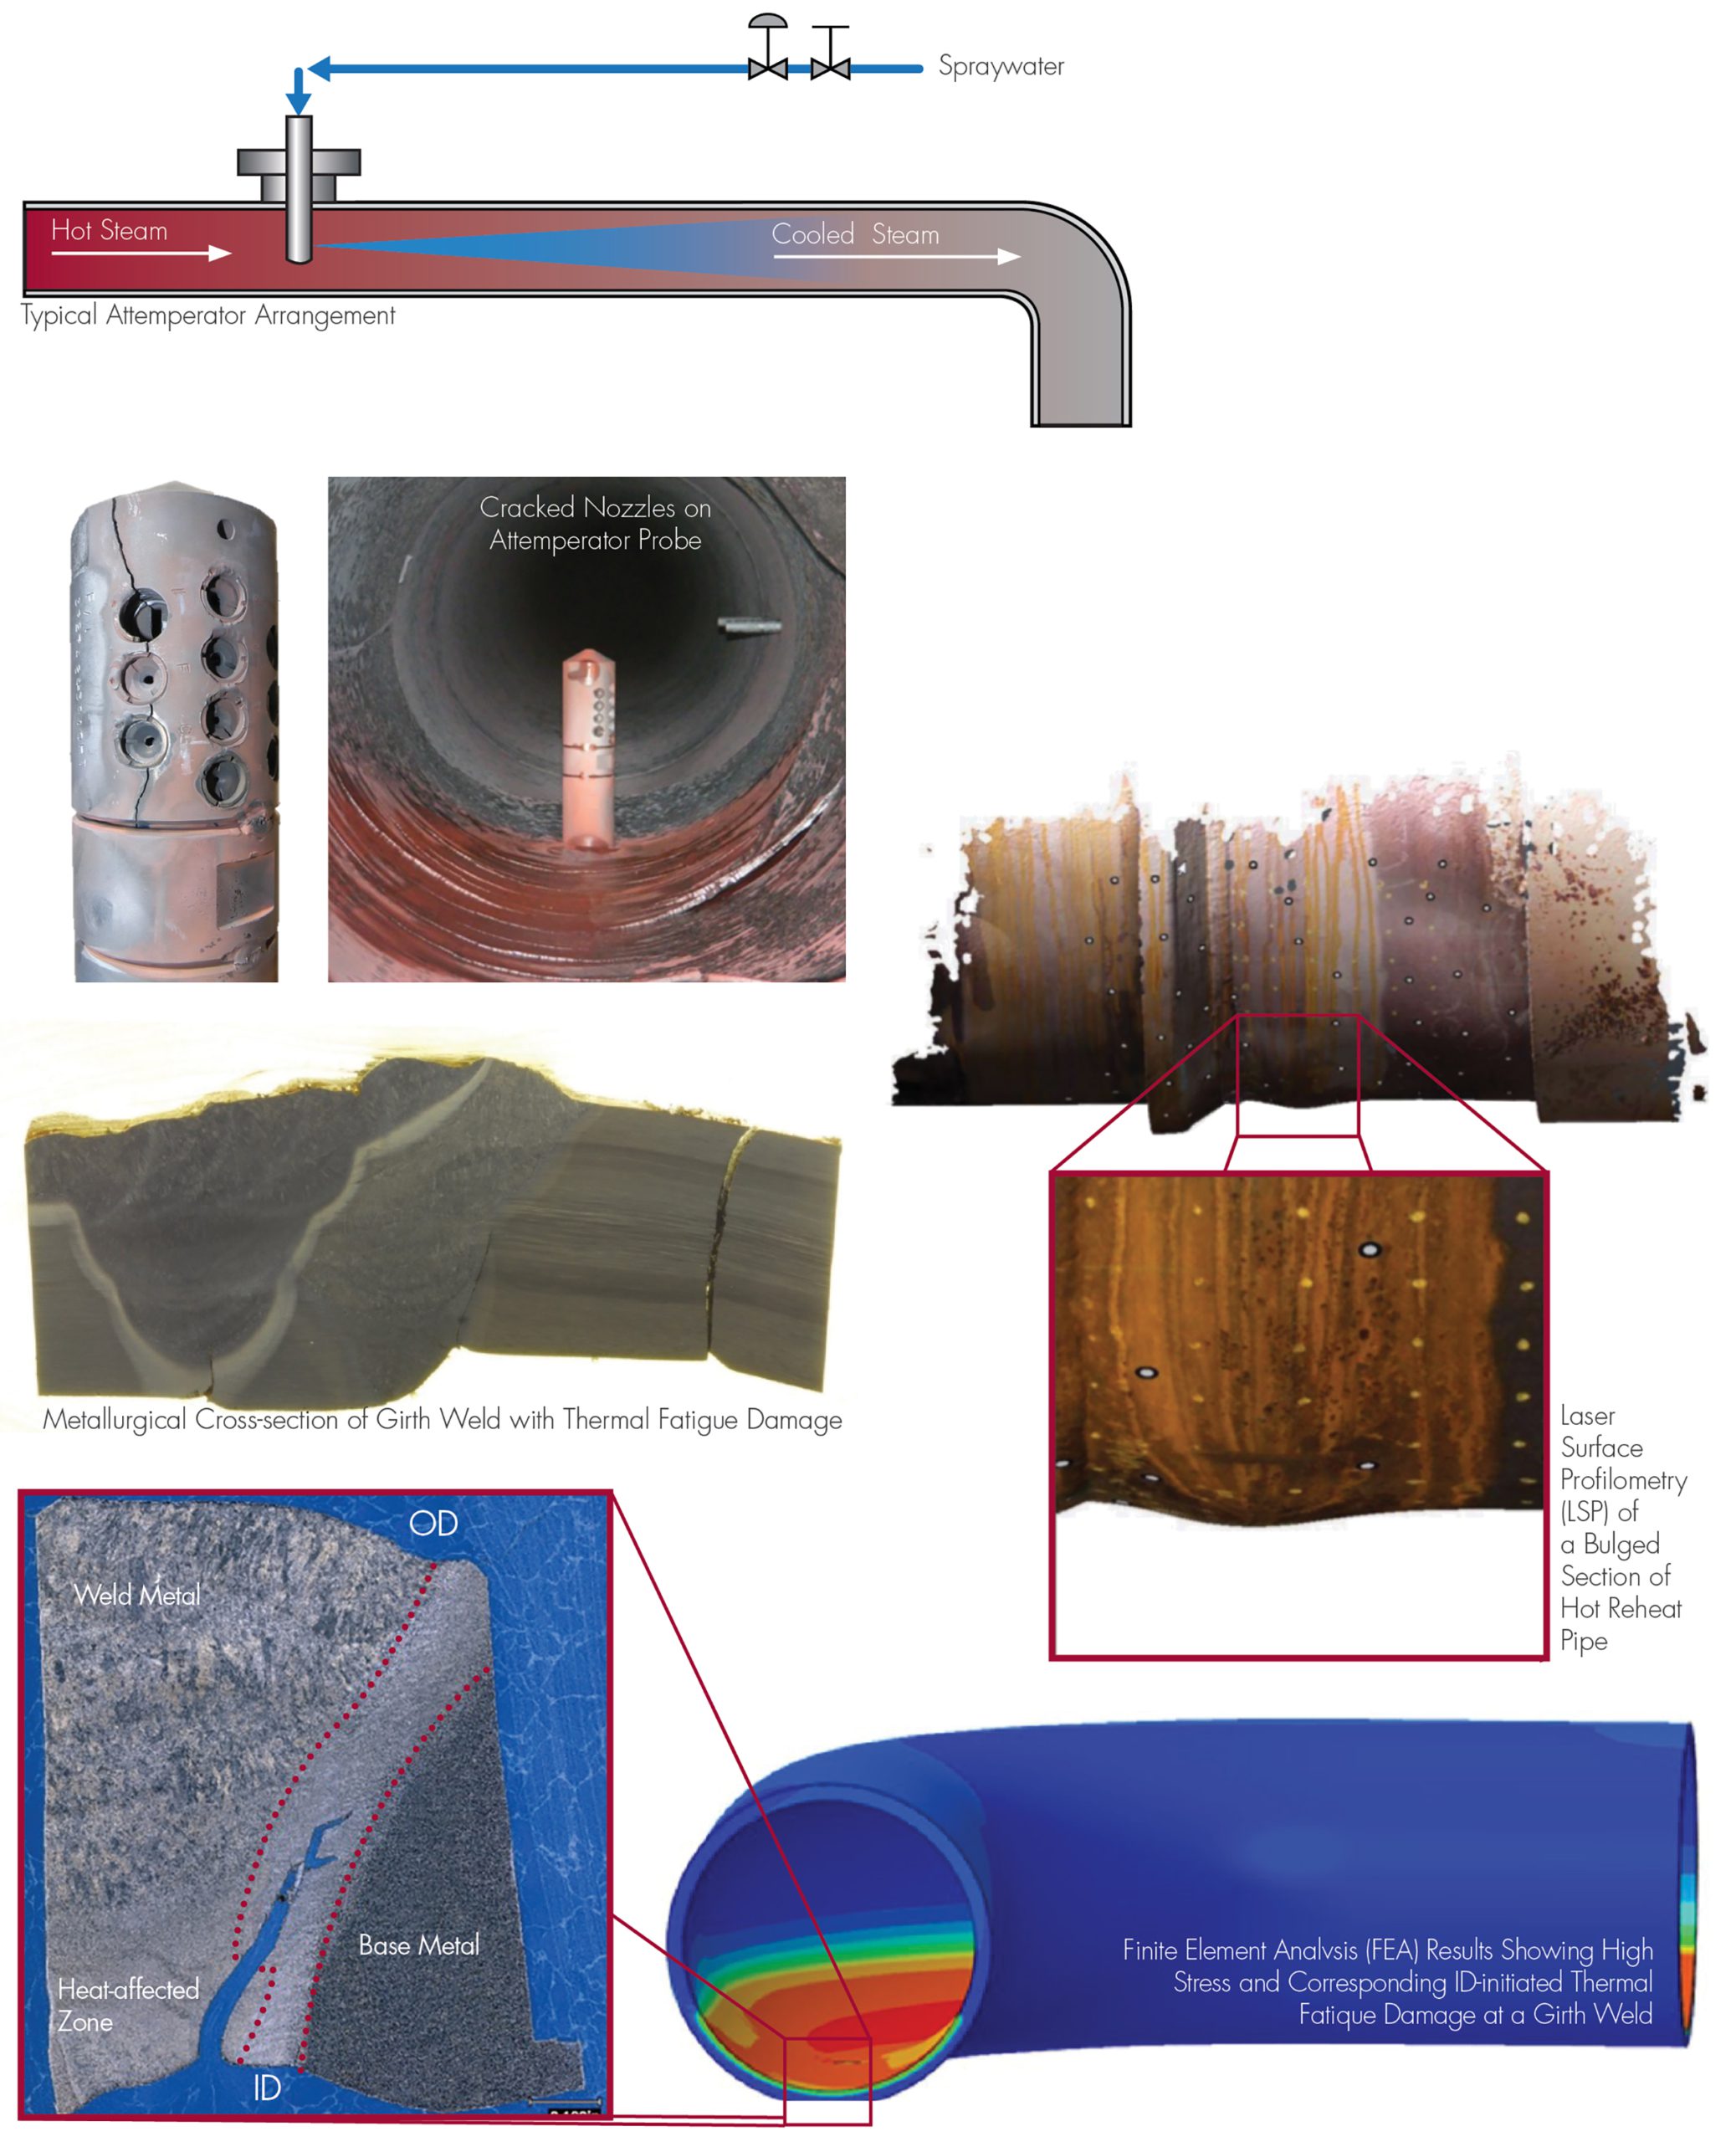
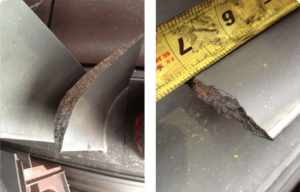
Figure 4. Examples of damage observed by SI on attemperators.
Reliable life consumption estimates are made by applying SI’s algorithms for real-time creep and fatigue damage tracking, which use operating data, available information on material conditions, and actual component geometry.
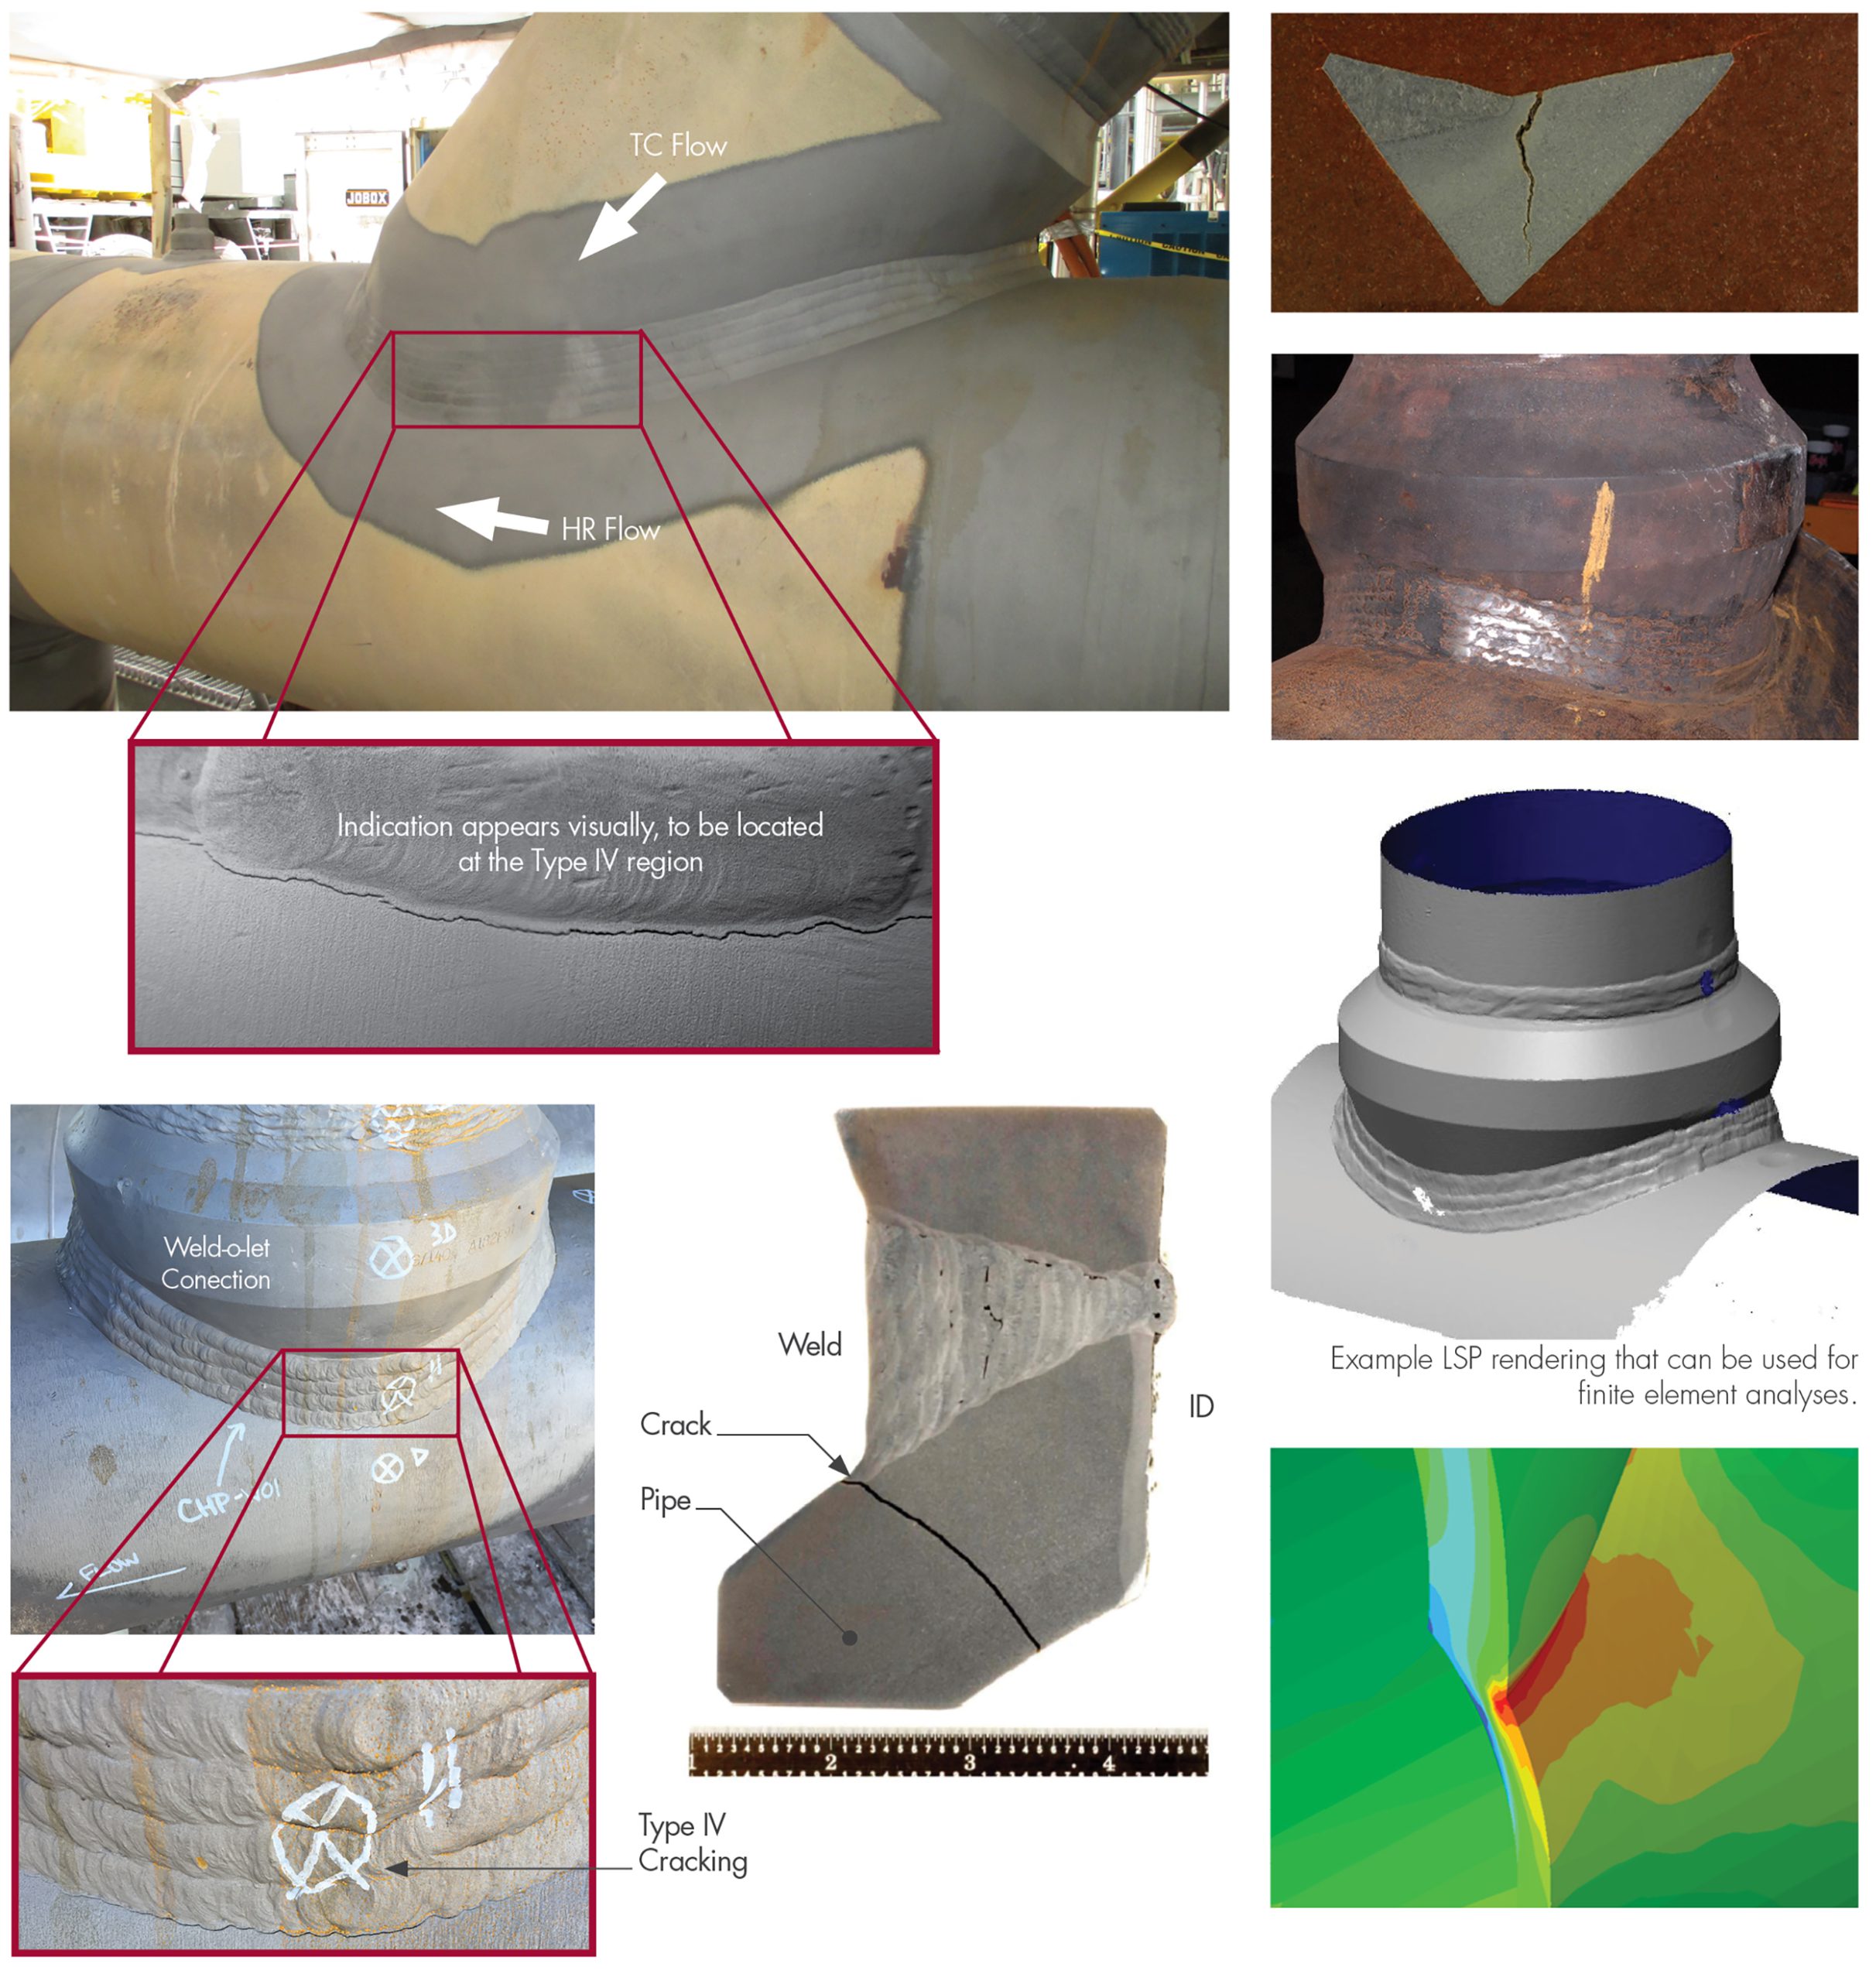
Figure 5. Examples of creep damage observed by SI on header link pipe connections (olets).
SIIQ tracks trends in damage accumulation to intelligently guide life management decisions, such as the need for targeted inspections, or more detailed “off-line” analysis of anomalous conditions. This marks a quantum leap forward from decision making based on a schedule rather than on actual asset condition.
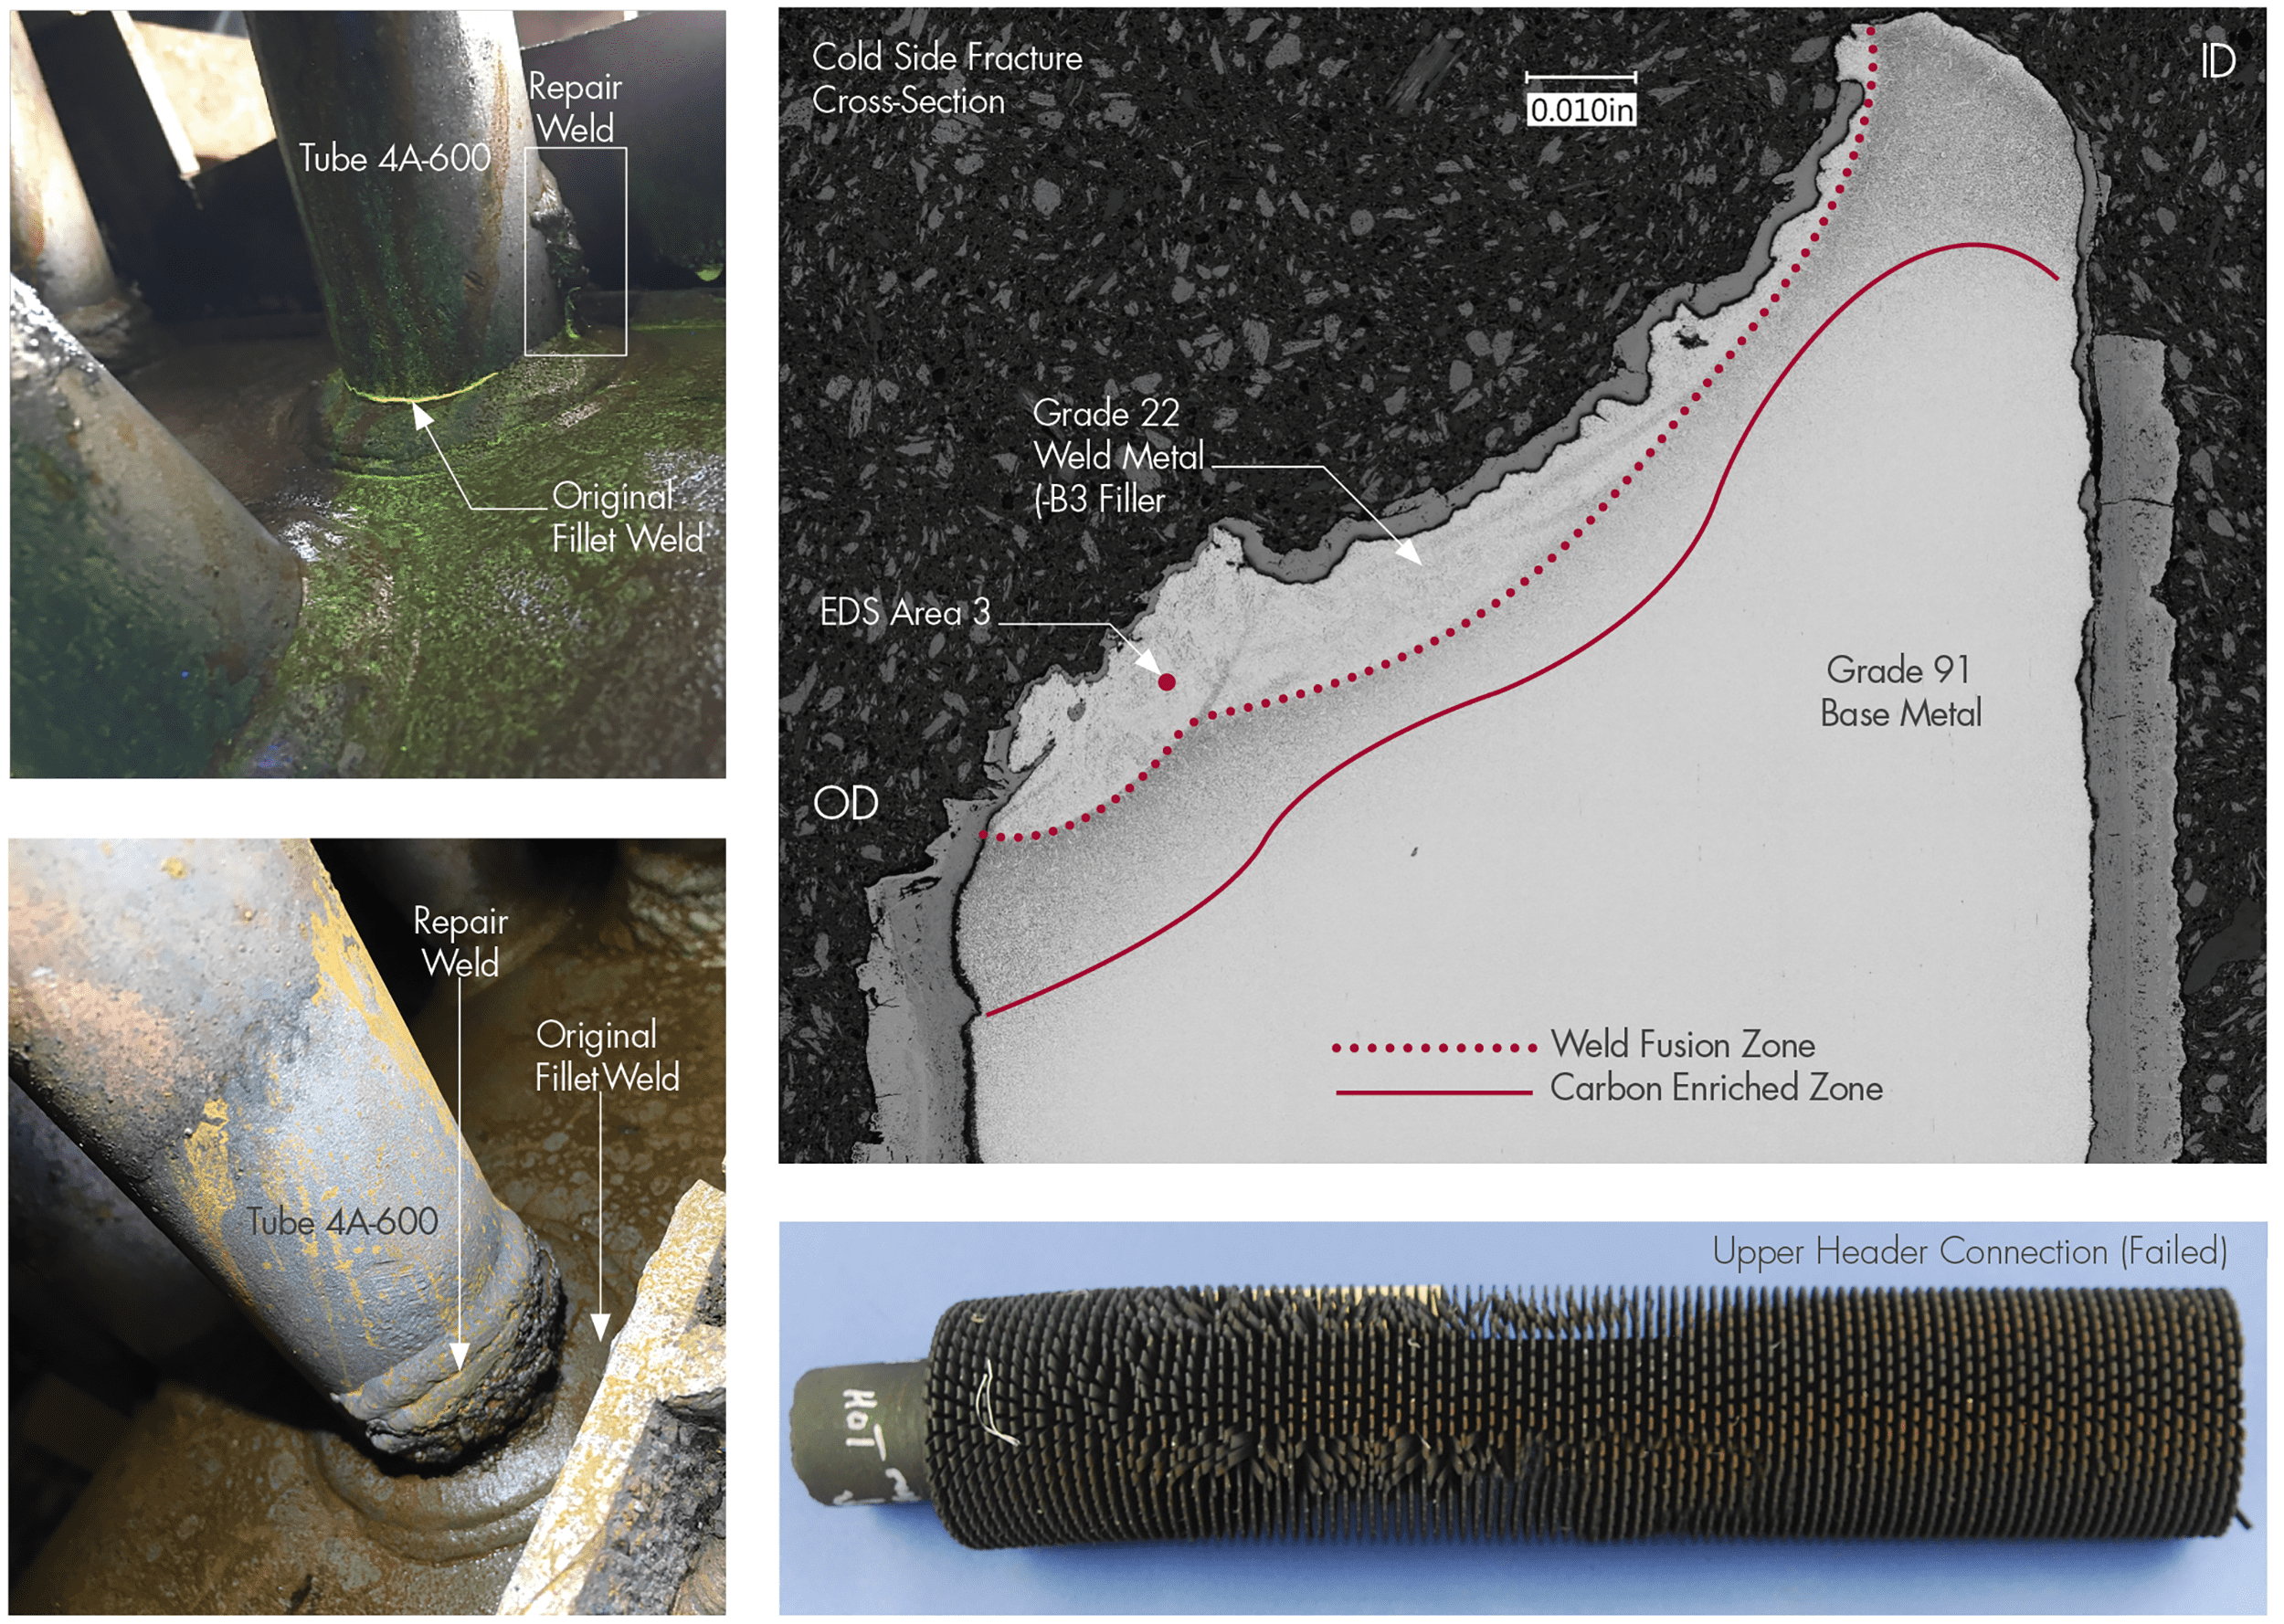
Figure 6. Examples of creep/fatigue damage observed by SI at tube-to-header connections.

Figure 7. Examples of online monitoring alerts generated from SIIQ
SIIQ can be configured to provide email alerts (Figure 7) when certain absolute damage levels are reached, or when a certain damage accumulation over a defined time frame is exceeded. In this way, the system can run hands-off in the background, and notify maintenance personnel when action might be required.
POWER PLANT ASSET MANAGEMENT
SI’s technology differs from most systems by focusing on MODELING OF DAMAGE MECHANISMS (e.g. damage initiation and subsequent rate of accumulation) affecting components that, if a failure were to occur, would impact safety and reliability.
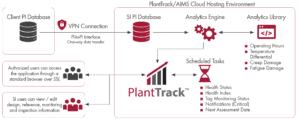
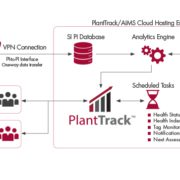
Figure 1. Typical architecture for connection to data historian.
SIIQ™ is part of the next-generation approach for managing assets through online monitoring and diagnostic (M&D) systems. The advancements in sensor technology, signal transmission (wired or wireless), data storage, and computing power allow for ever more cost-efficient collection and analysis of ‘Big Data.’
The online monitoring module of SI’s PlantTrack™ data management system can retrieve operating data from OSIsoft’s PI data historian (or other historians, for that matter – see above for typical architecture). Access to data from the historian is critical for moving beyond the stage of detecting adverse temperature events from the local surface-mounted thermocouples. Examination of pertinent data from select tags (as seen in Figure 3 of the article beginning page 29) is reviewed by SI experts to help derive a more optimal solution to mitigate further events. The benefit of the real-time monitoring is to detect improper operation and diagnose prior to damage progressing to failure. Continuously monitoring the condition allows for early remediation and potentially avoiding a failure that would result in loss of unit availability and possible personnel injury. Further, if monitoring indicates no issues are occurring, it may justify deferring a costly inspection.

CHARLOTTE, NC – Structural Integrity Associates (“SI”) www.structint.com, a leading specialty engineering consultant in the power and utility industry, and C2C Technical Services (“C2C”) www.c2ctechnicalservices.com, a leading electrical engineering and electrical field service company, are pleased to announce the formation of SI Solutions, LLC (“SI Solutions”) in partnership with Jumana Capital (“Jumana”) www.jumanacapital.com, a Houston, TX-based private investment firm specializing in partnerships with entrepreneur led companies.
SI was founded in 1983 in San Jose, CA, as an engineering and consulting firm dedicated to the analysis, control, and prevention of structural and mechanical failures with a core focus on critical equipment and structures in the power generation and utility infrastructure. Living true to the motto, “Powered by Talent and Technology,” SI has established itself as an innovative and responsive resource for answering any challenge ranging from R&D to engineering, metallurgy, fabrication, and non-destructive evaluation (NDE).
Texas City, TX-based C2C provides electrical engineering and specialty field services, including automation, instrumentation, electrical services, and technical staffing services for critical infrastructure maintenance within the renewables, petrochemical, and refining sectors.
SI Solutions will be a leading provider of mission-critical power and infrastructure engineering, testing, and maintenance services focused on existing assets. The platform will have more than 500 employees and nine offices, serving customers across the U.S. and internationally. The leadership team of SI Solutions will be comprised of the management teams of both SI and C2C, including C2C founders Charles Roachell and Craig Miller. Mark Marano, the former COO of the Westinghouse Electrical Company, came out of retirement to become the CEO of SI in February 2020 and will be the CEO of SI Solutions, in addition to remaining the CEO of SI. The CFO of SI Solutions will be Michelle Digilormo; Cam Tran will serve as Executive Director of HR.
“The SI Solutions platform with SI and C2C is the perfect fit for both companies. The combination enhances both platforms’ ability to grow and better serve client needs through additional investments in research and development, technical capabilities, field service offerings, and geographic reach. I am very excited about the future of SI Solutions,” said Mark Marano, CEO of SI.
“We are proud of what we’ve built at C2C and are excited to continue to drive growth in this next chapter”, says Charles Roachell, founder and co-president of C2C, “we believe our partnership with SI creates a best-in-class engineering and specialty service platform, led by a culture of safety and best practices. We will deliver the highest quality services to our customers and employees. We are excited to take the next step in building our platform”.
“The cultural fit of SI and C2C is unmatched in the industry”, says Craig Miller, founder, and co-president of C2C. “We value our highly skilled employee base and believe the combination of SI and C2C will create excellent opportunities for our employees to continue their professional and personal development. SI Solutions has an extremely bright future that we’re thrilled to be a part of”.
Chris Martin, Chief Investment Officer and Managing Director of Jumana Capital remarked, “SI Solutions is extremely well positioned to help meet the growing needs for asset management, compliance, maintenance, repair, and upgrade within the power generation, utility infrastructure, chemical, refining, and critical structures sectors in the United States and abroad. We are building something extraordinary and are excited for what the future holds for SI Solutions”.
Media Contact
Chris Sydor
Manager of Marketing and Communications
Structural Integrity Associates, Inc
info@structint.com
704-977-1361

January 31ST – February 2ND 2023
COURSE DESCRIPTION
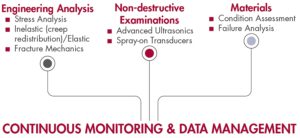
Our High Energy Piping (HEP) Seminar for the Power Industry will be held over 2.5 days (January 31st – until noon on February 2nd) in Austin, TX. During this time, we’ll share our comprehensive expertise on specific topics geared towards being proactive with regards to managing these assets. As the energy landscape has shifted and the call for more flexible operation has increased, it’s important that strategies are in place to ensure personnel safety and unit reliability are maintained. SI aims to provide attendees with a rich educational experience surrounding the following technology areas to provide a holistic review of component health:
THIS SEMINAR IS ESPECIALLY RELEVANT FOR
INSTRUCTORS
COURSE TOPICS
Development and Management of an HEP program
Stress analyses (explanation of the intricacies, when, what, and how to apply)
Metallurgical analyses (lab tour of SI’s Materials Lab, which may include an interactive review of samples)
Application of NDE (new techniques, post-processing methods, when, what, and how to apply)
Continuous monitoring and data management
EVENT DETAIL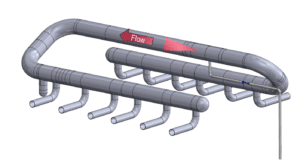
Event Date
Tuesday, January 31st – Thursday, February 2nd
Duration
8:00am to 5:00pm Tues. and Wed. 8:00am to 12:00pm on Thurs.
Individual Price
$1,195
Location
Lone Star Court
10901 Domain Drive Austin, Texas 78758
Telephone: 512-814-2625
We have negotiated a rate of $199/night plus taxes, you must book before January 10th to receive group rate. For reservations call 855-596-3398 and mention “SI HEP Seminar” to receive the group rate. Or you can book online using our booking link HOTEL REGISTRATION.
REGISTRATION CLOSED 2023
By: Clark McDonald
In the world of metallurgical failure analysis, areas of interest on broken parts can be colorful or drab, three-dimensional or flat, and most importantly, very big or very small. A big part of failure analysis work is telling the story, explaining the failure mode, or in some cases, showing that critical piece of evidence that explains why a metal component has failed. From wide-angled lenses to extremely high magnification scanning electron microscope imagery, documentation of failed components is a big part of the presentation.
In this edition of Structural Integrity’s Lab Corner, we wanted to provide some interesting content related to that middle-of-the-road region of magnification; closer than macro-photography but farther away than the 100X to 5000X magnifications that cover most of the applications requiring scanning electron microscopy. In other words, the comfortable world of optical microscopy, where colors, shapes, and even surface textures are part of the story. To do this, we’ve chosen some images that show the usefulness of quality optical microscopic documentation. Each of the provided examples include a brief description along with specific comments on the benefits of optical microscopy for that project, where applicable.
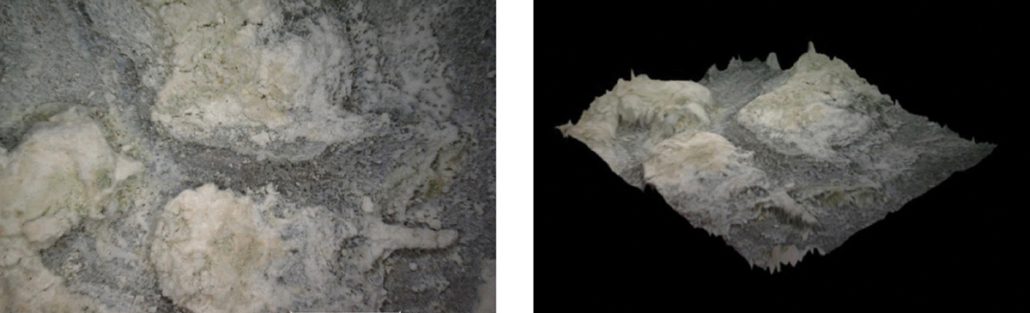
Figure 1. Two- and three-dimensional color images of an aluminum annode plate showing light-colored deposits that have caused uneven wastage. The 3D image shows the extent of material removal in locations where deposits are not present. Normal wastage in this application should be uniform.

Figure 2. Two- and three-dimensional color images showing fastener thread flank damage and a crack origin near the root of the upper thread. The 3D image shows that the crack origin is located on the thread flank rather than at the deepest part of the thread root.
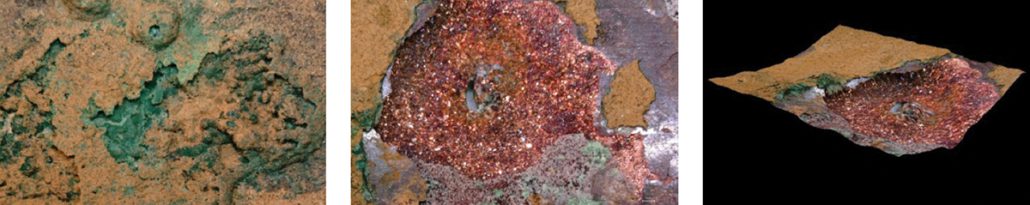
Figure 3. Two- and three-dimensional images of a copper heat exchanger tube that has been damaged from under-deposit corrosion (UDC). The image at left shows the typical appearance of the ID deposits. The center image shows a region of damage surrounding a pinhole leak. The 3D image provides an idea of the depth of internal corrosion in the tube.
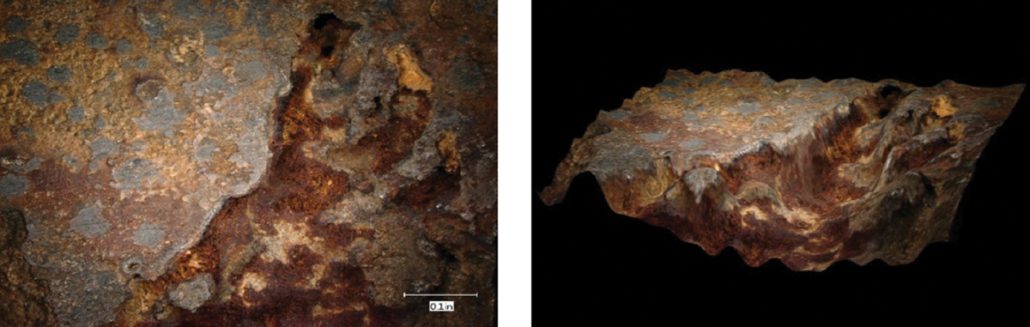
Figure 4. Two- and three-dimensional images of a region of damage on an internal surface of a feedwater pump. The image at left shows the appearance of brownish deposits found within the corroded region of the pump surface. The 3D image provides an indication of the depth and shape of the corrosion damaged region.
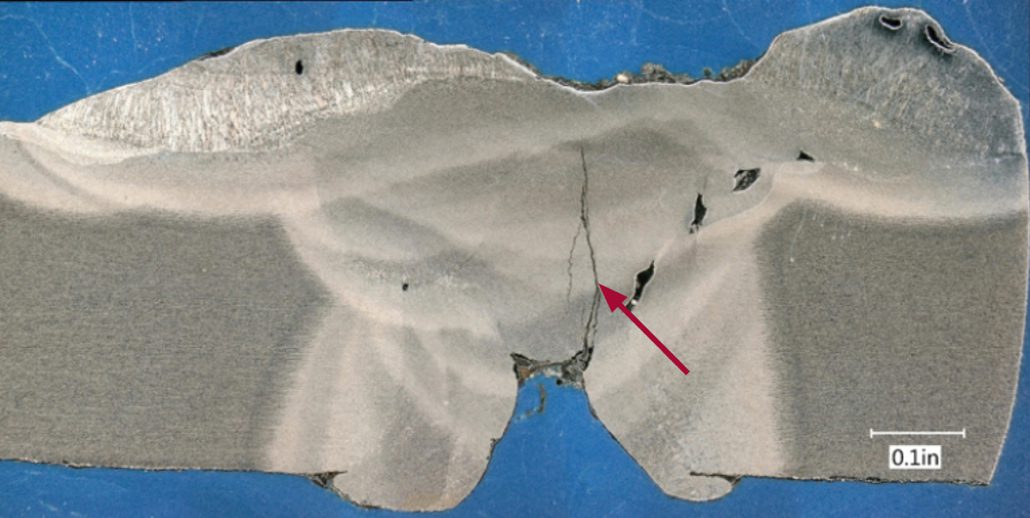
Figure 5. Two dimensional stitched image of a weld cross section showing cracking emanating from a shallow weld root. Porosity is also visible in multiple locations in the weld.
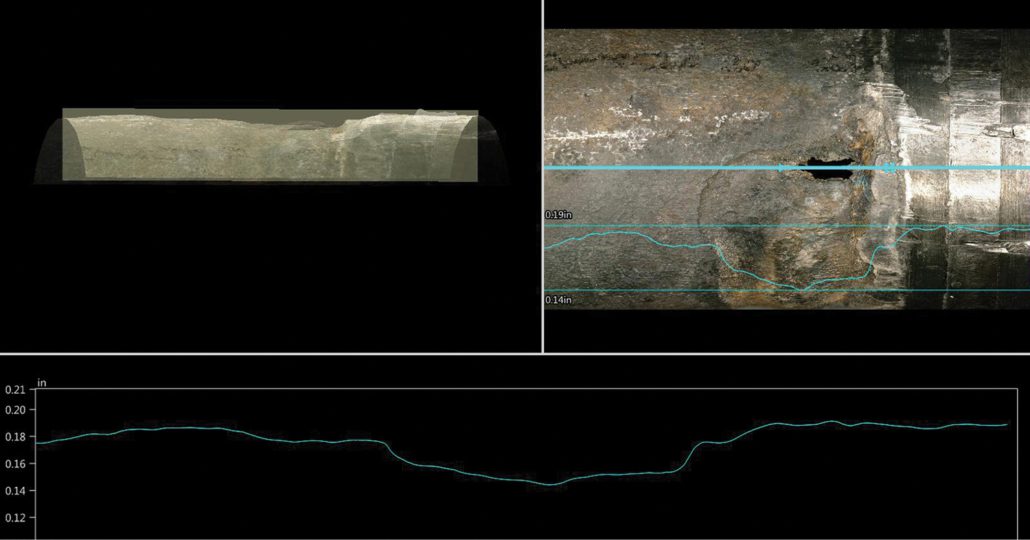
Figure 6. Images of a region of damage on the exterior of a heat exchanger tube where wastage has occurred near the tube sheet. The upper right image is a view of the leak location with an overlay of lines showing the position where the surface profile was documented as well as the depth profile (overlaid and in the lower image). The upper left image, which has an appearance similar to an x-ray, is a side view of the 3D image of the tube surface.

SI EXPANDED CAPABILITIES
By: Jason Van Velsor and Robert Chambers
 Structural Integrity (SI) has recently added drones to our toolbox of inspection equipment. Using drones, inspectors are able to complete visual inspections safely and more efficiently. Applications of drones for visual inspections include plant and piping walkdowns, structural inspections and atmospheric corrosion monitoring (ACM) of exposed pipeline.
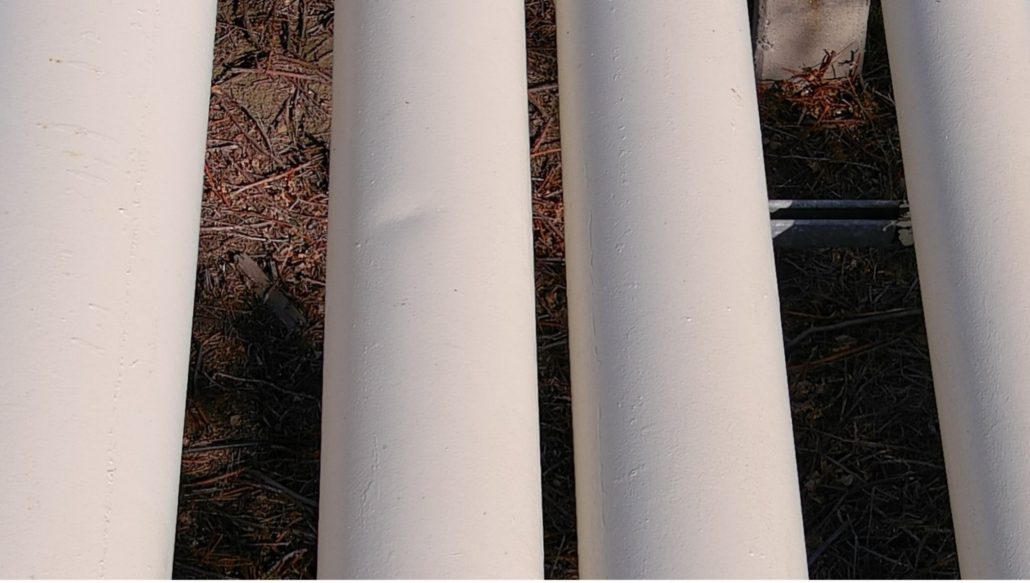
Figure 1. Drone image of a dent on an elevated section of pipeline
Pipe hanger walkdowns at fossil and combined cycle plants are part of a routine inspection process. During these inspections, the inspector is required to view and mark down pipe hanger positions and assess their condition. While some hangers provide easy access for the inspector, this is not always the case. Some of these may be located in elevated positions that require the plant to build out scaffolding, which not only increases the cost, but also can put the inspector at risk when working at elevation. With the use of drones, the inspector can fly up to the pipe hangers from a safe location and get a live high-resolution video feed from the camera mounted on the drone. Saving pictures and the video footage can also allow the inspector to go back and review the footage at a later time.
ACM is another example where drones have proven to be a useful tool. ACM inspections of outdoor above ground pipelines are typically done by
walking down the pipeline and recording any signs of atmospheric corrosion. There are many occasions where the pipeline will be elevated or cross over rivers and railroads, requiring scaffolding or fall protection. By using a drone to fly along the pipeline, the inspection can be completed much more efficiently and safely. In situations where a GPS signal is available, such as outdoor pipeline inspections, the GPS coordinates can be saved with each photo. Custom SI-developed software can then automatically compile the acquired images and create a KML file to be viewed in Google Earth, allowing the client to get an overview of the inspection results.
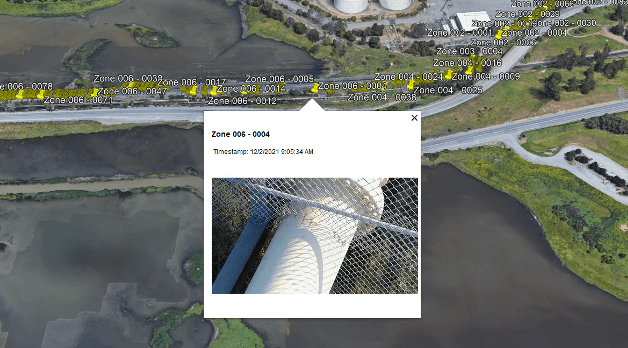
Figure 2. Google Earth view of image locations
Moving forward, SI plans to utilize these drones for more than just visual inspections. Possible applications could include using drones to perform ultrasonic thickness testing or Structural Integrity Pulsed Eddy Current (SIPEC™) examinations. All of SI’s pilots in command hold valid FAA Part 107 certificates and pilot registered drones.
PITTING CORROSION IN CONVENTIONAL FOSSIL BOILERS AND COMBINED CYCLE/HRSGS
By: Wendy Weiss
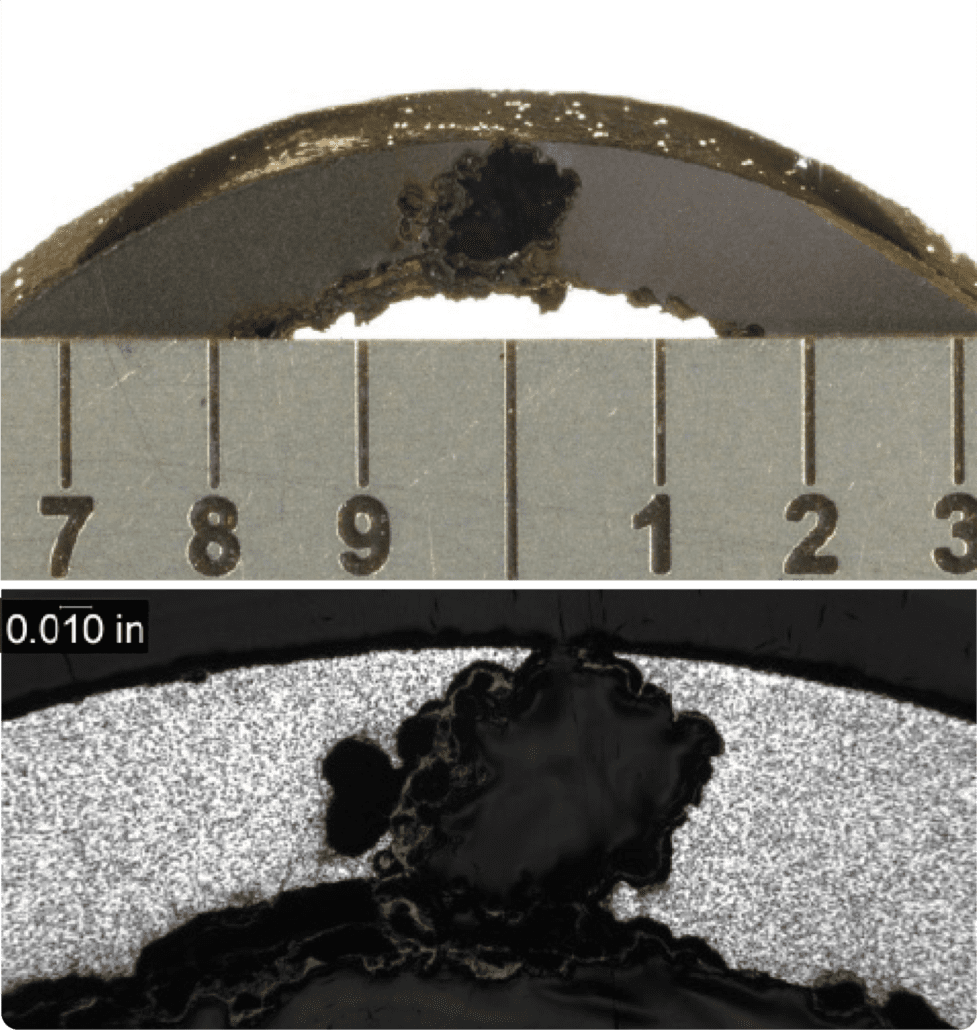
Figure 1. Severe pitting in a tube from a package boiler
Mechanism
Pitting is a localized corrosion attack involving dissolution of the tube metal surface in a small and well-defined area. Pitting corrosion can occur in any component in contact with water under stagnant oxygenated conditions. Pitting in economizer tubing is typically the result of poor shutdown practices that allow contact with highly-oxygenated, stagnant water. Pitting also may occur in waterwall tubing as a result of acidic attack stemming from an unsatisfactory chemical cleaning or acidic contamination.
Pits that are associated with low pH conditions tend to be numerous and spaced fairly close together. The pits tend to be deep-walled compared to the length of the defect. A breakdown of the passive metal surface initiates the pitting process under stagnant oxygenated conditions. A large potential difference develops between the small area of the initiated active pit (anode) and the passive area around the pit (cathode). The pit will grow in the presence of a concentrated salt or acidic species. The metal ion salt (M+A-) combines with water and forms a metal hydroxide and a corresponding free acid (e.g., hydrochloric acid when chloride is present). Oxygen reduction at the cathode suppresses the corrosion around the edges of the pit, but inside the pit the rate of attack increases as the local environment within the pit becomes more acidic. In the event that the surfaces along the walls of the pit are not repassivated, the rate of pit growth will continue to increase since the reaction is no longer governed by the bulk fluid environment. Pitting is frequently encountered in stagnant conditions that allow the site initiation and concentration, allowing the attack to continue.
The most common cause of pitting in steam touched tubing results from oxygen rich stagnant condensate formed during shutdown. Forced cooling and / or improper draining and venting of assemblies may result in the presence of excess moisture. The interface between the liquid and air is the area of highest susceptibility. Pitting can also be accelerated if conditions allow deposition of salts such as sodium sulfate that combine with moisture during shutdown. Volatile carryover is a function of drum pressure, while mechanical carryover can increase when operating with a high drum level or holes in the drum separators. Pitting due to the effects of sodium sulfate may occur in the reheater sections of conventional and HRSG units because the sulfate is less soluble and deposits on the internal surfaces. During shutdowns the moisture that forms then is more acidic.

Figure 2. Pitting on the ID surface of a waterwall tube
Typical Locations
In conventional units, pitting occurs in areas where condensate can form and remain as liquid during shutdown if the assemblies are not properly vented, drained, or flushed out with air or inert gas. These areas include horizontal economizer tubes and at the bottom of pendant bends or at low points in sagging horizontal tubes in steam touched tubes.
In HRSGs, damage occurs on surfaces of any component that is intentionally maintained wet during idle periods or is subject to either water retention due to incomplete draining or condensation during idle periods.
Attack from improper chemical cleaning activities is typically intensified at weld heat affected zones or where deposits may have survived the cleaning.
Features
Pits often are small in size and may be filled with corrosion products or oxide, so that identification of the severity of pitting attack by visual examination can be difficult.
Damage to affected surfaces tends to be deep relative to pit width, such that the aspect ratio is a distinguishing feature.
Root Causes
Figure 3. Pitting on the ID surface of an economizer tube
The primary factor that promotes pitting in boiler tubing is related to poor shutdown practices that allow the formation and persistence of stagnant, oxygenated water with no protective environment. Confirming the presence of stagnant water includes:
Carryover of sodium sulfate and deposition in the reheater may result in the formation of acidic solutions during unprotected shutdown and can result in pitting attack. Similarly flyash may be pulled into reheater tubing under vacuum and form an acidic environment.
By: Mike Battaglia and Jason Van Velsor
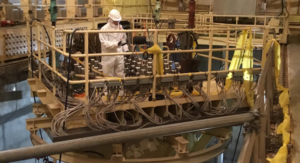
Figure 1. Heavy lift rig attached to reactor head in preparation for removal.
BACKGROUND
Proper control of heavy loads is critical in any industrial application as faulty equipment or practices can have severe consequences. The lifting technique, equipment, and operator qualifications must all meet or exceed applicable standards to ensure industrial safety. The significance of heavy lifts at commercial nuclear facilities is, perhaps, even greater. In addition to the consequences of an adverse event that are common to any industry (bodily injury or human fatality, equipment damage, etc.), the nuclear industry adds additional challenges. Such an adverse event in the nuclear industry can also affect (depending on the specific lift) fuel geometry / criticality, system shutdown capability, damage to safety systems, etc. One example of a critical lift in nuclear power facilities is the reactor vessel head / reactor internals lift.
The requirement to inspect the heavy lifting equipment for structural integrity is prescribed in NUREG-0612, Control of Heavy Loads At Nuclear Power Plants, as enforced by NRC Generic Letter 81-07. The aforementioned NUREG document describes specific requirements for special lifting devices. The requirements prescribed include:
In the case of the former requirement, it can be difficult or even dangerous to test these lift rigs, which are designed to carry over 150 tons, at a factor of 1.5x. In the case of the latter requirement, employing the more traditional NDE techniques of MT, PT, and UT to inspect the lift rigs can be costly (both in terms of labor and radiological dose) and time consuming, in terms of impact to outage critical path, depending on when the inspection is performed. In PWRs or BWRs, inspections are performed in the reactor containment, or radiation-controlled area, and are typically only performed during the outage.
Ultimately, the NRC requires licensees to determine how they will comply with the NUREG requirements. One method that has been adopted (primarily by PWR plants) is Acoustic Emission (AE) testing. AE testing is a non-destructive testing process that uses high-frequency sensors to detect structure-borne sound emissions from the material or structure when under load. The process detects these acoustic emission events and, based on sensor locations and the known sound velocity and attenuation, can identify the approximate location of the sources or areas of concern. If such areas are identified, based on analysis of the data captured under load, those areas must be further investigated to characterize the indication. Such additional techniques may include surface examination (MT or PT), or volumetric UT to precisely locate, characterize, and size any indications.
Employing an advanced technique such as AE can significantly reduce the time required to perform this evolution, also reducing both the cost and dose associated with meeting the NUREG requirements.
The original deployment of this method was championed by a utility in the mid-1980’s and has since been adopted by many of PWR plants as the preferred inspection method.
APPLICATION OF AE TESTING
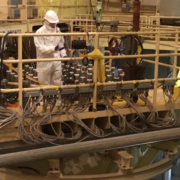
In 2021, SI began offering AE testing services for reactor head lift rigs, including the qualified personnel, equipment, and tooling necessary to perform this work. Our first implementation was at a nuclear plant in the Southeast US in the fall of 2021, and additional implementations are contracted in the spring and fall of 2022, and beyond.
There are several advantages to AE testing that make it uniquely suited for the vessel head (or internals) lift application. First, AE is a very sensitive technique, capable of picking up emissions from anomalies that cannot be detected by traditional techniques. This allows for identifying areas of potential / future concern before they are an imminent safety danger. Second, AE sensors are capable of sensing relevant emissions from a reasonable distance (up to 10 ft or more) between source emission and sensor placement. As such, AE testing can monitor the entire lifting structure with a reasonable number of sensors (typically less than 20) placed on the structure. Thus, sensors are strategically placed on the structure where failure is most likely – i.e., the mechanical or welded connections (joints) between structural members.
This strategic sensor placement has another inherent advantage unique to the AE process. If an indication is noted, the system has the capability to isolate the approximate source location (generally within a few inches) of the emission. This is accomplished using a calculation that considers the arrival time and intensity of the acoustic emission at multiple sensor locations. This is very beneficial when an indication requiring subsequent traditional NDE is noted as specific areas can be targeted, minimizing the scope of subsequent examinations.
The ability of AE testing to rapidly screen the entire lift structure for active damage growth saves time and money over the traditional load testing and comprehensive NDE approaches.
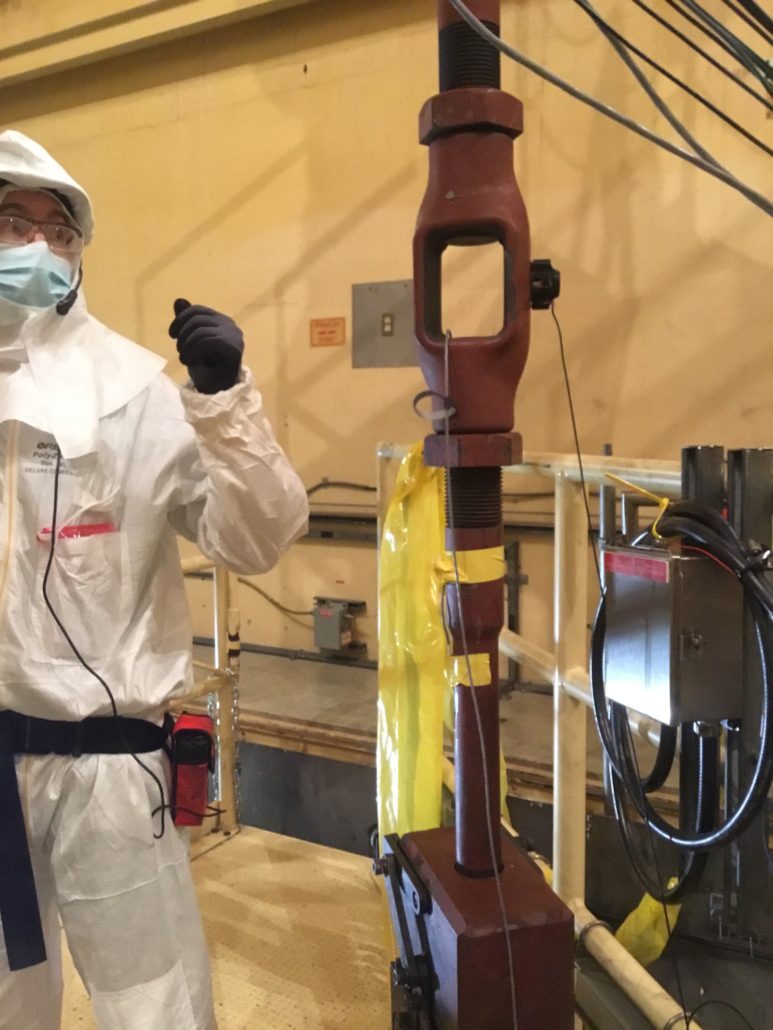
Figure 2. Lift rig turnbuckle outfitted with AE sensor.
Finally, and perhaps most importantly, the test duration is minimal and is, effectively, part of the standard process for reactor vessel head removal. Sensor placement is performed during the normal window of plant cooldown and vessel head de-tensioning, so outage critical path is not compromised. The actual test itself is performed as part of the head (or internals) lift; that is, when the head breaks from the vessel flange (and maximum load is achieved), the load is held in place for 10 minutes while monitoring for and recording acoustic emission activity. Each sensor (channel) is analyzed during the hold period and a determination is immediately made at the end of the 10-minute period as to whether the lifting rig structure is suitable for use. Unless evidence of an imminent failure is observed, the lift immediately proceeds to the head (or internals) stand. The gathered data are also analyzed on a graded basis. Depending on the energy intensity of the events detected at each sensor, subsequent recommendations may range from: ‘Good-as-is’, to ‘recommend follow-up NDE post-outage’.
The basic process of implementation is:
SI VALUE ADD
During our fall 2021 implementation, SI introduced several specific process improvements over what has been historically performed. These advances have enhanced the process from both a quality and schedule perspective. A few of these enhancements are:
COMMERCIAL GRADE DEDICATION OF THE SYSTEM
SI developed and deployed a commercial grade dedication process for the system and sensors. Often, licensees procure this work as safety-related, meaning the requirements of 10CFR50 Appendix B apply. The sensors and processing unit are commercially manufactured by a select few manufacturers that typically do not have QA programs that satisfy the requirements of 10CFR50, Appendix B. For this reason, SI developed a set of critical characteristics (sensor response, channel response to a simulated transient, etc.) and corresponding tests to validate that the system components are responding as-expected and can be adequately deployed in a safety-related application.
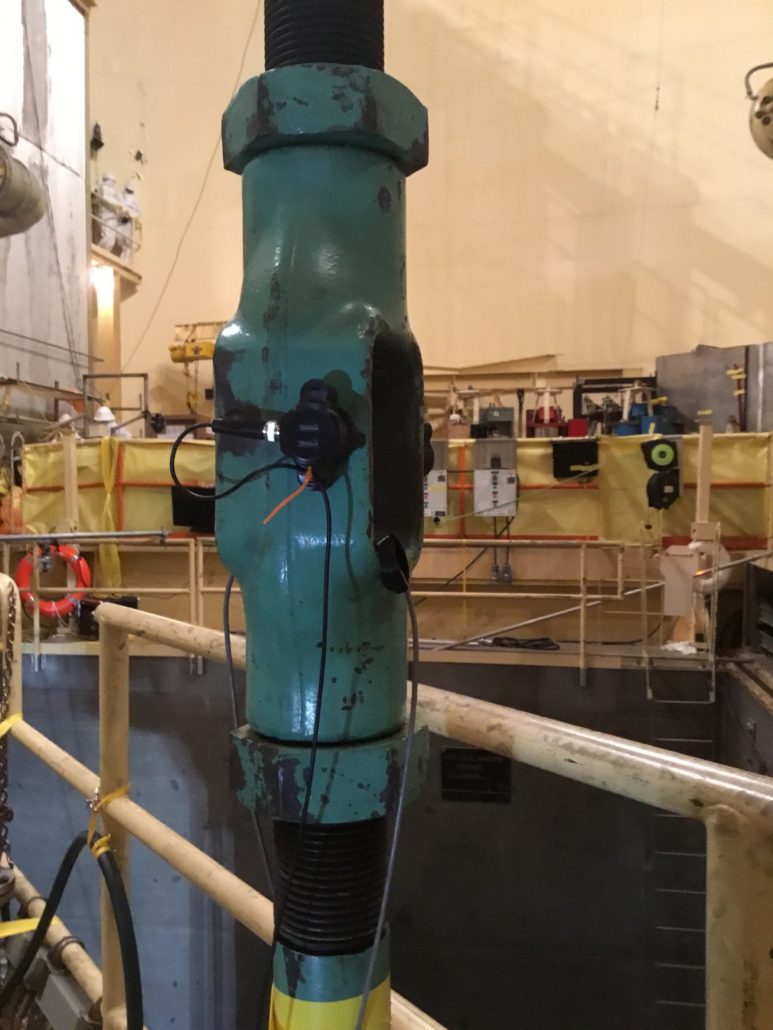
Figure 3. Close-up of AE sensor.
EMPLOYING STRAIN GAUGES FOR MAXIMUM LOAD
The arrival time of an acoustic emission at one of the installed sensors is measured in milliseconds. For this reason, it is critical to initiate the 10-minute hold period precisely when peak load is reached. The historical method for synchronizing peak-load with the start of the hold period relied on the use of a stop-watch and video feed of the readout from the containment polar crane load cell. When the load cell appears to max out, the time is noted and marked as the commencement of the test. This approach can be non-conservative from a post-test analysis perspective as the data before the noted start time is typically not considered in the analysis. As the strain gauge correlation provides a much more precise point of maximum load that is directly synchronized with the data acquisition instrument, it is more likely that early acoustic emissions, which are often the most intense and most relevant, are correctly considered in the analysis.
REMOTELY ACTUATED IMPACTORS
One of the methods used in AE testing to ensure that the sensors are properly coupled and connected is a spring-loaded center punch test. This test employs a center punch to strike the component surface, resulting in an intense sound wave that is picked up by all the sensors. However, this test has historically been performed manually and required someone to physically approach and touch the lifting equipment. In certain applications, this can be a safety or radiological dose issue and, additionally, can add time to an already time-critical plant operation. For this reason, SI has introduced the use of remotely actuated impactors to perform this function. The result is equivalent but entirely eliminates the need to have personnel on the lift equipment for the test as this task is performed remotely and safely from a parametric control center.
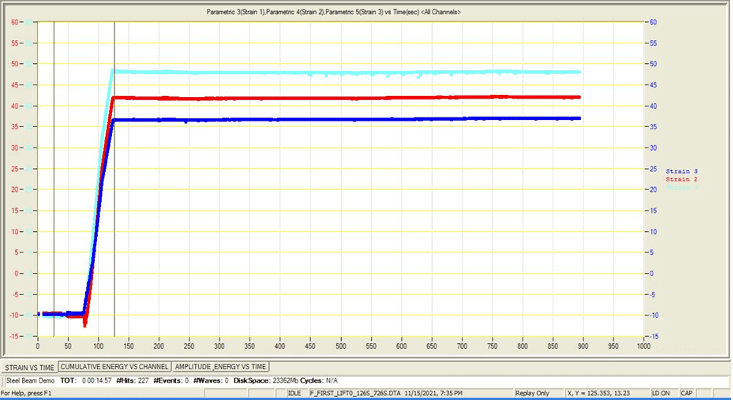
Figure 4. Strain gauge output showing precise timing of peak load on lift rig.
CONCLUSION
Employing cutting-edge AE testing for your vessel head / internals heavy lift can save outage critical path time, reduce radiological dose, and identify structural concerns early in the process. All of this leads to inherently safer, more efficient verification of heavy lift equipment.
SI has the tools, expertise, and technology to apply cutting-edge AE testing to your heavy lifts. SI is committed to continually improving the process at every implementation. Improvements in software processing time, and setup / preparation time are currently in-process. Finally, other potential applications for the method are also possible, and we stand ready to apply to the benefit of our clients.

Recovery Best Practices
By: Dan Tragresser
 With the reduction in staffing at power plants over the past 2 decades, many traditionally routine engineering and maintenance tasks have fallen by the wayside. With limited resources, operations and engineering personnel must focus their time and efforts based on priority. Quite often, keeping a unit online or quickly returning a unit to service will take priority over continuous improvement actions such as investigations and root cause analysis.
When a unit trips or experiences an event, the site will incur costs associated with the loss in production and regulatory penalties. Based on the severity, the outage scope may include hardware replacement and, if applicable, the purchase of make-up power. These costs can quickly drive the decision to make the return to service the only priority. Unfortunately, the review of event operational data, event precursors, and the collecting evidence through the unit disassembly very often falls below the priority of returning to service. Collecting or re-creating evidence after the fact is nearly impossible. This lack of priority often results in a lack of understanding of the root cause of the trip or event.
Within large, complex plants and turbomachinery, trips or minor events are common but are rarely isolated, one-off events. Many trips and events are repetitive in nature and, worse, are early indications of a more serious event to come. While the cost of delays in returning to service may be high, the cost of not solving the root cause may be orders of magnitude higher, particularly if a failure event happens a second time.
Focusing on unit trips, best practices include:
Focusing on unit events, the cost of an event requiring an outage and hardware replacement, not including make-up power purchase, can very quickly escalate to millions of dollars. Compare that cost to the cost of a dedicated, independent resource for the duration of time required to perform a comprehensive investigation. Also, consider the cost of the investigation versus the cost of reoccurrence or a similar event with more serious consequences. The cost of the resource and investigation will almost always be in the noise of the overall cost. Best practices include:
Identifying the root cause of an event might be cumbersome, but far less cumbersome than dealing with the same type of event on a recurring basis.
Structural Integrity has team members and laboratory facilities available to support event investigations and to act as independent consultants on an emergent basis.
SIGN UP FOR OUR NEWSLETTER
*Join the conversation. Sign up to receive emails, events, and latest information!
1-877-4SI-POWER
(1-877-474-7693)