CIRCUMFERENTIAL THERMAL FATIGUE IN CONVENTIONAL WATERWALL TUBES
By: Wendy Weiss
Circumferential Thermal Fatigue damage in Conventional Waterwall Tubes most commonly appears as circumferentially oriented cracking in the waterwalls of coal-fired supercritical units. Initially, the formation of ripple magnetite was a significant factor in the formation of this damage. Later, the introduction of oxygenated treatment controlled the formation of ripple magnetite, thus greatly reducing this damage mechanism.In the early 2000s, however, this type of thermal fatigue began occurring more frequently as low NOx burners and separated overfire air systems were introduced.
Figure 1. Tube with a series of circumferential cracks
Mechanism
Three basic factors contribute to this type of thermal fatigue damage.
The first factor is the starting tube temperature (i.e., the temperature under normal operating conditions). The higher the starting temperature, the greater the accumulation of damage in the affected tubing. For example, tubes subjected to higher heat flux or tubes with thick weld overlays will have higher average metal temperatures and accumulate damage more quickly.
The second factor is the extent of gradually increasing tube temperature caused by reasons such as internal deposit buildup, flame impingement, or unstable flow.
The third factor is the contribution of thermal transients due to slag shedding or using sootblowers or water cannons.
Essentially, the thermal fatigue cracking results from the combination of increasing tube metal temperature and thermal transients and is aggravated by high starting tube temperatures.
Figure 2. The external surface of the tube after the external deposits were removed
TYPICAL LOCATIONS
Figure 3. Cross-sectional views of the cracking in the etched (Top) and unetched (BOTTOM) conditions
Tubes with slag buildup and shedding
Areas affected by wall blow quenching
High heat flux locations
Areas affected by flame impingement
Cracking can be localized or widespread
Tends to be contained within a relatively narrow range of elevations
FEATURES
Circumferentially oriented, multiple, parallel cracks along the hot side of the tubes.
Notch shaped, oxide filled cracks in cross-section.
Adjacent tubes can exhibit variability in crack density.
ROOT CAUSES
High Initial Waterwall Tube Temperatures
Thick weld overlays
Higher heat flux
Flame impingement
Increasing Waterwall Tube Temperatures
Internal deposits including ripple magnetite, thick oxide layers, or feedwater corrosion products
Reduced internal flow rate
Formation of external oxides and deposits
Severe Thermal Transients
Natural or forced slag removal, including slag shedding and sootblowing
Use of water cannons or improper sootblowing
Flame instabilities
Unit operation, including forced fan cooling, rapid startups, frequent load cycling
Structural Integrity Associates, Inc. (SIA) is pleased to announce the appointment of Michael Battaglia as Vice President, Nuclear and Chief Nuclear Officer. Mr. Battaglia has served the prior three years leading the Project Management Office and Nuclear Business Development areas at SIA. During his 25-year career in the nuclear industry, Mr. Battaglia has held a variety of leadership roles that span operations and business development. Of Mr. Battaglia’s many operational accomplishments, building and leading the Westinghouse Balance of Plant Engineering Department, and leading the commercial deployment of a new alloy 600 mitigation technology in the US., are exemplary. In addition to his operational experience, Mr. Battaglia’s business development expertise has consistently enhanced the position of the business in the markets he has served.
Mark W. Marano, President and CEO of SIA, commented, “Mike’s blend of operational and business development backgrounds will bring a holistic approach to the implementation of the long-term strategic vision for SIA’s Nuclear business. His reputation of being highly engaged, not only with clients but with the entire staff at SIA, cements my confidence that this transition will go smoothly and pave the way for growth.”
Mr. Battaglia holds a B.S. in Industrial Engineering and an MBA from the University of Pittsburgh.
https://www.structint.com/wp-content/uploads/2023/09/Mike-Battaglia-News.jpg363668Structural Integrityhttps://www.structint.com/wp-content/uploads/2023/05/logo-name-4-930x191-1.pngStructural Integrity2023-08-21 19:34:242023-09-20 19:55:29SI Appoints New Leadership
INTRODUCTION The PEGASUS nuclear fuel behavior code features a robust 3D, finite element modeling (FEM) computational foundation capable of performing both thermo-mechanical and structural non-linear analyses within a highly versatile and customizable computational platform. The first applications of PEGASUS were for light water reactor (LWR) fuels and materials. Development work on PEGASUS has been extended to advanced fuel designs such as those proposed for Advanced Technology Fuel (ATF) LWR applications and Gen IV reactor designs, including gas and liquid metal-cooled reactors (GCRs and LMRs).
The versatility and adaptability of PEGASUS is key in enabling extensions to non-conventional operating environments, materials, fuel forms, and geometries.
LWR APPLICATIONS SiC Cladding
Figure 1. SiGA cladding is a multi-layered composite design composed of SiC fiber in a SiC matrix.
A project is underway to further the development and irradiation testing of a composite silicon carbide matrix as an ATF cladding material. This research is supported through a DOE Funding Opportunity award (DE-FOA-0002308) for the irradiation of a composite silicon-carbide (SiC) ceramic matrix material in an existing U.S. commercial LWR. This work is led by General Atomics – Electromagnetic Systems (GA-EMS) with Structural Integrity Associates (SIA) as a primary subcontractor. For this work, PEGASUS is being adapted to model monolithic and composite SiC manufactured by GA-EMS, SiGA [1], through the incorporation of proprietary material constitutive models. PEGASUS will then be used to provide independent test performance analyses aiding in the design of the irradiation vehicle and predicted material performance. The goal of the testing is to gather irradiation data under prototypic LWR operating conditions and to inform and confirm material performance models for the SiGA-based cladding. A follow-on activity is planned to evaluate the predicted performance compared to data gathered during the post-irradiation examination phase of the project.
Figure 2. Lightbridge Fuel Design PEGASUS Models
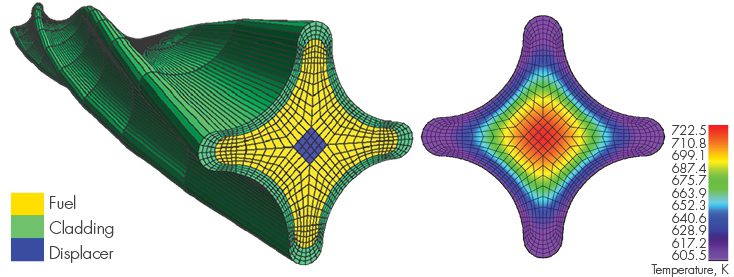
Cruciform Metallic Fuel An additional fuel concept that has been explored using PEGASUS is a cruciform, extruded metallic fuel design proposed by Lightbridge Corporation [2]. This fuel is characterized by a unique multi-lobed fuel cross-section and features a U-50Zr fuel composition. Recent work has been published on fabrication testing of this proposed fuel design by Pacific Northwest National Laboratory (PNNL) [3]. PEGASUS has been used previously to prototype 2D and 3D geometric models and meshes of Lightbridge fuel and to perform fundamental temperature and stress distributions for this fuel under prototypic LWR conditions. PEGASUS has specific modeling tools designed to facilitate “extruded” 3D fuel designs that automate the meshing of these geometries. More work in this area is planned as a proposal has recently been awarded under the DOE NEUP program (DE-FOA-0002732) funding a collaborative project led by Texas A&M University along with Lightbridge, NuScale, and Structural Integrity Associates, Inc. (SI) for modeling this type of fuel for application in a LWR SMR.
URANIUM METAL ALLOY FUELS FOR SODIUM-COOLED FAST REACTORS The initial implementation of metallic alloy fuel and stainless-steel cladding material constitutive models for prototypic fast reactor fuel designs in PEGASUS has been completed. Material properties and behavioral models for U-Pu-Zr fuel and HT-9 (high Chromium, martensitic stainless steel) cladding have been added. Ongoing work includes the implementation of a gaseous swelling and fission gas release behavior model for U-Pu-Zr fuel, a Zr-redistribution model, and a fuel-cladding chemical interaction (FCCI) model that includes the effect on cladding wall thinning.
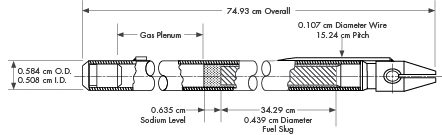
To test the implementation of these models, benchmark tests were prepared that provided comparative data for assessment of the models’ performance. Test cases were chosen from two experimental series irradiated in EBR-II: X430, a 37-pin hexagonal sub-assembly, and X441, a 61-pin bundle. These experiments were designed to test numerous fuel rod design variables and fuel response as a function of fuel alloy composition, smear density, plenum-to-fuel volume ratio, power, and coolant conditions [4]. The general experimental fuel rod design corresponds to the typical driver fuel configuration shown in Figure 3.
Figure 3. Typical EBR-II Mark-III or Mark-IIIA Fuel Element [5]
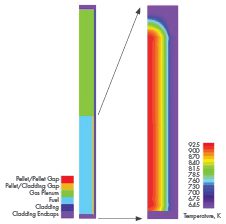
Figure 4. Left: 2D Computational Model of Rod DP2, Right: Temperature Contour Plot of the Fuel Stack Region for Rod DP21 at Peak Power (plenum region removed for detail)
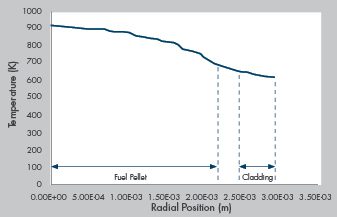
An illustration of the model and selected results from the initial analysis of rod DP21, assembly X441 are shown in the figures above. Figure 4 provides a diagram of the computational model showing the primary components of the model and a plot of the temperature distribution throughout the fueled region of the rod at peak power. Figure 5 provides the radial temperature profile across the fuel rod from the center to the cladding outer surface at peak power near the end of the irradiation period. Temperatures vary from just ~900 K at the pellet center to ~650 K at the cladding surface. The temperature differential is fairly low at ~250 K, as would be expected from a high-conductivity metal fuel rod with a Na-bonded fuel cladding gap. These results are consistent with published experimental observations.
TRISO FUEL MODELING DEVELOPMENT Several advanced fuel material models have been implemented specifically for TRISO fuel in PEGASUS, including thermal and mechanical models for UCO or UO2 kernels, PyC, SiC materials, and a fission gas release model for computing the release of gaseous fission products such as Xe and Kr. In addition to the standard 3D and 2D axisymmetric modeling FEM capabilities in the code, PEGASUS contains several unique tools designed specifically to support TRISO fuel modeling and analysis. These include a “spherical mesh object” tool that can automate the process of generating 2D/3D TRISO spheres, meshing them, and embedding them into a fuel matrix to allow modeling of individual TRISO kernels or fully encapsulated TRISO fuel forms. An example of models generated using the spherical mesh object tool is shown in Figure 6. The spherical mesh object capability is, to our knowledge, unique to PEGASUS and not found in any other fuel performance or general-purpose FEM code. PEGASUS also has a “reshape” function that can automate the process of meshing and modeling deformed TRISO particles to increase user efficiency. Figure 7 illustrates particle meshes that were created using the reshape meshing tool.
These modeling capabilities allow PEGASUS to be used to investigate very detailed mechanical and structural effects in TRISO fuel forms. For example, enabling the detailed analysis of the mechanical interaction between TRISO fuel layers explicitly examining the effects of cracking, debonding, and asphericity within whole or damaged particles.
Figure 5. Radial Temperature Distribution Across the Fuel Rod Model at ~ 486 Days of Irradiation
Planned future development work includes the integration of damage-mechanics modeling and fission product diffusion in the TRISO particle, fuel compact, ad matrix. One failure mode of particular interest that has been identified is cracking of the IPyC layer which propagates through the SiC outer layer. This can create a pathway for enhanced fission product release from the TRISO particle to the surrounding fuel matrix. This failure mechansim appears to occur when the buffer layer remains bonded to the IPyC layer providing the conditions for a synergistic mechanical and chemical failure mechanism that combines cracking, stress concentration, and chemical corrosion (localized Pd-induced corrosion in the SiC [6]. This failure mode is of interest because it can have a strong impact on fuel source term determination for operational TRISO fuel.
Figure 6. Temperature distribution in a cross-section of a 3D slab of a TRISO compact matrix model with a “sparse”, random kernel distribution under prototypic gas-cooled reactor conditions. (Generated using the “spherical mesh object” tool.)
SUMMARY PEGASUS is an advanced analysis tool developed for industry applications that can provide a complimentary and independent capability for nuclear fuel performance. Recent development work on PEGASUS has focused on expanding the applicability of the code to the advanced fuel (ATF) and advanced reactor arena. Future development is planned for PEGASUS that will continue along multiple avenues with an emphasis on advanced fuels and specific thermo-mechanical issues within the industry, such as deterministic failure model development. One example of this is the aforementioned Pd-induced failure mechanism identified for TRISO fuel. SI is actively seeking partners within the advanced fuel community to collaborate with on this work and would welcome inquiries and proposals for expanded application of PEGASUS.
Figure 7. Deformed 3D TRISO particle meshes generated using the “reshape” function tool in PEGASUS.
References
C. P. Deck et al., Overview of General Atomics SiGA™ SiC-SiC Composite Development for Accident Tolerant Fuel, Transactions of the American Nuclear Society, Vol. 120, Minneapolis, Minnesota, June 9–13, 2019.
J. Malone, A. Totemeier, N. Shapiro, and S.Vaidyanathan, Lightbridge Corporation’s Advanced Metallic Fuel, Nuclear Technology, Vol 180, Dec. 2012.
Z. Huber and E. Conte, Casting and Characterization of U-50Zr, PNNL-33873, Pacific Northwest National Laboratory, Richland, Washington 99354, Jan. 2023.
C. E. Lahm, J. F. Koenig, R. G. Pahl, D. L. Porter, and D. C. Crawford, “Experience with Advanced Driver Fuels in EBR-II,” J. Nucl. Mat. 204 (1993) 119-123.
G. L. Hofman, M. C. Billone, J. F. Koenig, J. M. Kramer, J. D. B. Lambert, L. Leibowitz, Y. Orechwa, D. R. Pedersen, D. L. Porter, H. Tsai, and A. E. Wright. Metallic fuels handbook, Technical Report ANL-NSE-3, Argonne National Laboratory, 2019.
J.D Hunn, C.A. Baldwin, T.J. Gerzak, F.C. Montgomery, R.N. Morris, C.M. Silva, P.A Demkowicz, J.M. Harp, and S.A. Ploger, Detection and Analysis of Particles with Failed SiC in AGR-1 Fuel Compacts, Nuclear Engineering and Design, April 2016.
The summer issue of Structural Integrity’s biannual technical newsletter, News and Views, is now available. We are excited to once again bring you this free source of technical information and advancements spanning multiple engineering disciplines and programs. In it, our expert team of Associates from our Nuclear, Energy Services, Pipeline Integrity Compliance Solutions, and Metallurgical Laboratory groups address vital topics relevant to your business.
PREPARING CLIENTS TO MEET NEW PIPELINE AND SAFETY REGULATION
By: Bruce Paskett and Erica Rutledge
On April 8, 2022, the Pipeline and Hazardous Materials Safety Administration (PHMSA) published amendments to 49 CFR Part 192 in the Federal Register issuing new valve installation and rupture detection requirements for onshore transmission pipelines and gathering pipelines .The effective date of the Final Rule (“Valve Rule”) is October 5, 2022.
The new rule is complex and creates challenges for operators. Since 2011, Structural Integrity has been advancing practical and cost-efficient methods to address pipeline safety.
GENERAL OVERVIEW As a result of two high-profile transmission pipeline accidents in 2010 , the congressional Pipeline Safety, Regulatory Certainty, and Job Creation Act of 2011 (2011 PIPES Act) was enacted.The legislation contained several mandates for PHMSA to issue regulations addressing improvements to pipeline safety.One of the mandates required PHMSA to issue regulations for the use of Automatic Shut-off Valves (ASV) or Remote-Control Valves (RCVs), or equivalent technology, on newly constructed or replaced gas transmission pipeline facilities.
The Valve Rule addresses this congressional mandate by establishing minimum standards for the installation of Rupture Mitigation Valves (RMVs) or alternative equivalent technology (AET) on specified newly constructed or entirely replaced onshore natural gas transmission, Type A gas gathering and hazardous liquid (e.g., oil and gasoline) pipelines that have diameters of 6 inches or greater.
The Valve Rule covers the following topics:
New Definitions
Rupture Mitigation Valves (RMVs)
Changes in Class Location and Valve Spacing
Emergency Plans and Response
Failure and Incident Investigation
Notification of Potential Rupture and Response to Rupture Identification
Valve Shutoff Requirements for Rupture Mitigation
RMV Valve Maintenance
Preventative and Mitigative Measures for Pipelines in HCAs
NEW DEFINITIONS (§192.3) The Valve Rule defined “notification of potential rupture” as notification of, or observation by an operator, of the specific indications of an unintentional or uncontrolled release of a large volume of natural gas from a pipeline.PHMSA has defined “rupture identification” to mean the point when a pipeline operator has sufficient information to reasonably determine that a rupture occurred.
RUPTURE MITIGATION VALVES (RMVs) (§192.179) The Valve Rule prescribes new rupture mitigation valve (RMV) installation requirements on certain pipeline segments with diameters of six inches or greater that are constructed or “entirely replaced” after April 10, 2023 in accordance with §192.179.The RMV installation requirements only apply to entirely replaced pipelines if the addition, replacement, or removal of a valve is part of the replacement project.
“Entirely replaced” is defined as replacing two or more miles, collectively, of any contiguous five miles of pipeline during a 24-month period.
Gas pipeline segments in Class 1 or Class 2 locations that have a potential impact radius (PIR) of 150 feet or less are exempt from RMV installation requirements.
An RMV is defined as an automatic shut-off valve (ASV) or remote-control valve (RCV) “that a pipeline operator uses to minimize the volume of gas released from the pipeline and to mitigate the consequences of a rupture.”
Operators may elect to use an alternative equivalent technology (AET) in response to the RMV installation requirements if the AET provides an equivalent level of safety.This process must be demonstrated and requested by the operator in a notification pursuant to §192.18 for PHMSA review. An operator requesting use of manual valves as an AET must include in the notification submitted to PHMSA a demonstration (e.g., evidence) that installation of an RMV would be economically, technically, or operationally infeasible.
CHANGES IN CLASS LOCATION AND VALVE SPACING (§192.610) The Valve Rule also applies where class location changes occur, and gas pipeline replacements are necessary to comply with Part 192 maximum allowable operating pressure (MAOP) requirements.For Class Location changes that occur after October 5, 2022, and which are considered being entirely replaced, operators are required to comply with the valve spacing and RMV installation requirements. These valves must be installed within 24 months of the change in Class Location.
For replacements not considered entirely replaced, theoperators must either:
Comply with the valve spacing requirements in accordance with §192.179(a) for the replaced segment, or
Install or use RMVs or AETs so that the entirety of the replaced pipeline segment is between two RMVs or AETs. The distance between the RMVs/ AETs may not exceed 20 miles.
The requirements above do not apply to pipeline replacements that are less than 1,000 feet within any single continuous mile during any 24-month period.
EMERGENCY RESPONSE (§192.615(a)) In the event of a potential or confirmed transmission or distribution pipeline rupture, the Valve Rule prescribes new requirements for operators to establish and maintain communication with appropriate public safety answering points (i.e., 9-1-1 emergency call center).Operators must revise their procedures to require immediate and direct communication to 9-1-1 call centers or coordination with local government officials located in the communities and jurisdictions in which the pipeline rupture is located.
FAILURE AND INCIDENT INVESTIGATION (§192.617) In the event of a pipeline rupture involving the closure of an RMV and/or AET, an operator must conduct an analysis of the factors that may have contributed to the rupture and implement measures to minimize the consequences of a future incident.Operators must also complete a summary of the post-failure or incident review within 90 days of the incident.The summary must be signed by a senior executive officer and retained for the useful life of the pipeline.
NOTIFICATION OF POTENTIAL RUPTURE AND RESPONSE TO RUPTURE IDENTIFICATION (§192.635) The Valve Rule requires operators who identify a potential rupture or are notified directly from an external credible source(s) of a potential rupture, to take action(s) on their transmission pipeline system.“Notification of potential rupture” may be based on one or more indications such as an unanticipated pressure loss greater than 10 percent in 15 minutes or less, an unanticipated flow rate or pressure change, or a rapid release of a large volume of gas, fire, or explosion in the vicinity of the pipeline.
An operator must develop procedures documenting how it observes a potential rupture or receives notification of a potential rupture and the actions to be taken in response to a potential and confirmed rupture.Upon notification of a potential rupture, operators must evaluate the potential rupture as soon as possible to confirm if it is a rupture.
VALVE SHUTOFF REQUIREMENTS FOR RUPTURE MITIGATION (§192.636) The Valve Rule prescribes new valve shut-off requirements. After rupture confirmation, the operator must fully close any appropriate RMVs or AETs necessary to minimize the volume of gas released from a pipeline and mitigate the consequences of the rupture as soon as practicable but within 30 minutes of rupture identification. Other valves necessary to isolate the pipeline segment must be closed as soon as practicable.
VALVE MAINTENANCE (§192.745) PHMSA revised the existing §192.745 to require operators to conduct valve maintenance, inspection, and operator drill activities to ensure each RMV or AET can achieve the prescribed 30-minute valve closure time.If during the drill, the 30-minute response time is not achieved, the operator must revise its rupture response efforts as soon as practicable to achieve compliance, but no later than 12-months after the drill.Any valve found inoperable during this test must be repaired or replaced as soon as practicable but no later than 12 months after the valve is determined to be inoperable. The operator must also select an alternative valve to act as an RMV within seven calendar days.
PREVENTATIVE AND MITIGATIVE MEASURES (§192.935) The Valve Rule requires gas transmission operators to conduct a risk analysis/assessment on their transmission pipeline system to analyze whether an RMV or AET is an efficient means of adding protection to an HCA.The risk analysis/assessment must consider timing of leak detection and pipe shutdown capabilities, the type of gas being transported, operating pressure, the rate of potential release, pipeline profile, the potential for ignition, and the location of the nearest response personnel. The risk analysis/assessment must be reviewed by operator personnel at least once per calendar year, not to exceed 15 months, and certified by a senior executive.
SI PROVIDES OPERATOR SUPPORT Structural Integrity has significant expertise in pipeline safety regulatory compliance and has been heavily involved in the Valve Rule since 2011. Our dedicated and substantial resources are ready to help with specific procedures and programs, including:
Risk Analysis and Assessment of RMVs on transmission pipeline systems.
Review and update of all existing procedures impacted by the new regulatory requirements, including emergency response, valve installation, operations, and maintenance.
Development of new, comprehensive procedures and processes to support compliance with the Valve Rule, which include defining Gas Control Room responses to potential ruptures, significant gas releases, and confirmed ruptures.
References
PHMSA Pipeline Safety: Requirements of Valve Installation and Minimum Rupture Detection Standards Final Rule.
A CASE STUDY FROM THE FERMILAB LONG BASELINE FACILITY
By: Keith Kubischta and Andy Coughlin, PE, SE
REFRESHER OF PART 1
From part one of the article (see News and Views Volume 51), we looked at the performance of a unique tubular mass concrete structure – the decay region of Fermilab’s Long Baseline Neutrino Facility – under complex thermal loading and thermal expansion. In the process of colliding subatomic particles in an accelerator and beaming them across the country underground, the facility contends with a massive amount of heat, an active nitrogen cooling system to remove energy, and shielding necessary for the surrounding environment. As we discussed in Part 1, Structural Integrity assisted with the design of the concrete structure by calculating the pertinent structural and thermal behavior under normal operation. Now for Part 2, we focus on forecasting the future life of the structure using advanced capabilities in analysis and delve into the actual life of this concrete structure while considering the construction process, a 30 year planned cycle of life, and how these influence planning for structural monitoring systems. In doing so, we attempt to answer a larger question: What can we learn from this structure that could be applied to other past and future structures?
These methods are not only applicable to new structures.Armed with the knowledge we can gain from record drawings, visual inspection, and non-destructive examination, SI is able to predict the life of concrete structures, new and old, giving key insights into their behavior in the future.
Figure 1. Fermilab Long Baseline Neutrino Facility (source https://mod.fnal.gov/mod/stillphotos/2019/0000/19-0078-02.jpg)
Figure 2. Adiabatic Temperature Rise for Concrete Placement
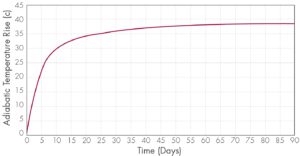
HEAT OF HYDRATION In understanding the life of a structure, we must first start at the beginning as the concrete is first poured where another heat transfer takes place. Contrary to popular belief, concrete does not “dry”, rather it “bakes” itself during the curing process. As concrete is poured, it begins heating up internally through an exothermic hydration reaction between water and cement. The effect of the heat of hydration can usually be ignored in typical thin-walled structures. In larger mass concrete structures, however, the heat generation can cause significant degradation and built-in damage that can affect the structural performance throughout the entire life of the facility.
A secondary subroutine as part of the ANACAP models is used for heat of hydration specific for construction analysis to convert the temperature rise into volumetric heat generation rate for thermal analysis. When heat is trapped deep inside the structure and can’t escape, the concrete exhibits a temperature rise similar to the curve in Figure 2, which is a function of the concrete mix proportions.
Figure 3. Placement Sequence of 164 Concrete Pours
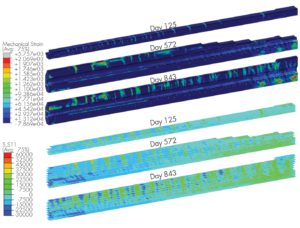
CONSTRUCTION ASSESSMENTS For the operating conditions covered in Part 1, the coupled 3D thermal stress analyses performed on this project were thermal conduction steady-state analyses. Construction of such a large concrete structure is subjected to additional requirements, and a Nonlinear Incremental Structural Analysis (NISA) was performed to evaluate the structure under the construction loadings. Herein, the thermal analysis during the concrete placement sequence requires a transient numerical solution methodology. This thermal analysis was used to monitor additional requirements for temperature during concrete placement, and a mechanical NISA study monitored the movement of the central cooling annulus vessel. The complete NISA coupled thermal-stress analysis simulated the entire construction phase over the period of a year and a half of the planned construction schedule. To accomplish this, the model was segmented into 164 concrete pours, each one activated (turned on) within the model on a specific day outlined in a construction schedule, as shown in Figure 3. As the concrete is poured on its specific day, the heat of hydration begins to heat up the internals of the concrete, the outside ambient temperature pulls the heat away from the concrete, and formwork insulates the heat transfer temporarily before being removed. As each new concrete segment is poured (activated in the simulation) it begins a new heat cycle, shedding heat into surrounding segments, changing surfaces that are exposed to air, or where the formwork is located. Upon completion of the thermal NISA study, Structural Integrity could advise on peak temperatures of each pour (Figure 4), compare internal to external temperatures and make optimal recommendations for insulation to keep the concrete from cooling too fast.
Figure 4. Thermal Views and Monitoring of Concrete Placement Temperatures
With the thermal NISA study completed, we then coupled the thermal with the mechanical stress analysis following a similar procedure. The model was broken up into the same 164 segments, with the reinforcement separated into individual segments. As a segment was poured, its weight was first applied as pressure on surrounding segments before the segment cured enough and took load. Formwork was considered a temporary boundary condition (simulated with stiff springs): activated then removed when appropriate. The concrete internal reinforcement was activated with each concrete segment. The cycles continue with each additional segment added. The concrete material for each segment had its own values for aging, creep, shrinkage, and thermal degradation for when the concrete was placed. The effect of creep and shrinkage could be significantly different for concrete poured on the first day and concrete that is poured a year later.Mechanical tensile strain, a proxy for cracking, was plotted as shown in Figure 5.
A critical issue of concern was the steel annulus structure at the center of the concrete tunnel. The entire steel structure was placed prior to concrete being poured around it. The steel structure was affected by the thermal and mechanical loads of each concrete pour. Structural Integrity showed this structure “breathing” as thermal/mechanical loads pass from each concrete pour into the steel structure. Armed with a complete picture from the NISA stress analysis, Structural Integrity could show the animation of annulus movement, check the out-of-roundness, and advise on reinforcement placement.
Figure 5. Concrete Mechanical Strain (i.e., Cracking) and Rebar Stress During NISA Construction
LIFECYCLE ASSESSMENTS During the design phase, reinforced concrete structures are typically designed for a bounding range of expected loads, to include thermal load cycles, periodic live load variations, and/or vibration from mechanical equipment. Up to this point, the design phase analysis started from a “pristine” uncracked structure and applied the expected load with the beam and cooling at full power. Seldom is the cumulative impact of cyclic loading considered for the expected service life of the structure. Structural Integrity, having performed the NISA study, now had significantly more accurate state of the structure with expected cumulative damage already built-up. This gave us the unique opportunity to extend the analysis from the current state through the lifecycle of the structure, comparing the “pristine” to the “cumulative” case.
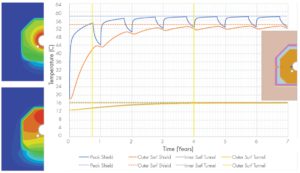
The expected life of the structure is 30 years of operations with the beam running for no more than nine months a year and three months off. These cycles are grouped together in either seven- or five-year blocks with a rest period of two years for maintenance or upgrades in between. The experiment starts small, ramping up the power to half the total output for the initial seven years. For the lifecycle assessment, time is still a critical element, not just for properties of concrete affected by time but the physical computational time. The transient thermal analysis would be too time intensive to run over the 30 years of life that we want to observe. To simulate the thermal cycles, the beam steady-state thermal response was calculated at each peak power level. This provided different thermal states of power, which the mechanical analysis could switch on or off as needed and interpolate between them to give a simulated ramp of power. The computational time could then be utilized on the mechanical stress lifecycle assessment.
Figure 6. Out-of-Roundness Check through Lifecycle, Ratcheting Effect of Power Cycles
With the completion of the lifecycles analysis, Structural Integrity could once again provide valuable information to the researchers and designers: deformations of the entire structure, deformations of the annulus, out-of-roundness of the annulus (Figure 6), estimates of crack width, etc.
Most importantly, we can answer and show comparisons between the designed load from a “pristine” model analysis to those from the “cumulative” analysis.
Even prior to the lifecycle assessment, the cumulative damage at the end of the NISA study signaled different behavior in the expected cracking (Figure 7). From the construction process, the concrete showed cracking near the boundaries between each concrete pour. These developed due to the natural thermal cycling of the construction process. The lifecycle thermal loading continued to push and pull the structure adding to the already existing cracks. Previously, the boundary point between the fixed rail and sliding rail section concentrated the thermal loading to induce significant cracking. Now the stress will be more evenly distributed throughout the upstream section. The cracking during construction provided natural thermal breaks along the whole length of the structure.
Figure 7. Concrete Strains at Various Point in Structures Lifecycle
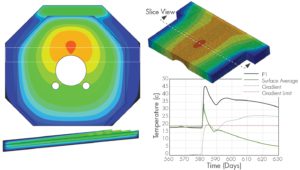
HEAT DISPERSAL
SI then turned toward an additional question, where does all this excess heat go as the beam is cycling power? The shielding concrete is still heating up to over 60 degrees Celsius at the exposed surfaces. The air around the shielding concrete is trapped by the decay tunnel and venting conditions are unknown. We would need to produce a calculation based on the transfer of heat from the shielding concrete to the surrounding air/access tunnel, to the decay tunnel itself, and then the surrounding soil. Assuming the worst-case scenario, a point was selected along the length of the tunnel that produces maximum temperatures in the concrete. The cross section at this point is turned into a 2D model for use in a thermal analysis conducted as steady-state and transient to explore the heat transfer into the surrounding sections. A temperature profile of the decay tunnel wall was used to check its design from the thermal gradients, shown in Figure 9. The temperature of the air space between the structures can be monitored help in planning for when the tunnel can safely be accessed.
ONLINE MONITORING Engineers at SI are always eager to add data to our models.As this structure is constructed and put into service, the actual construction and startup sequence is likely to change, allowing for the model to be rerun and the lifecycle projection recalculated.Furthermore, data from temperature sensors and crack monitoring gauges could potentially help calibrate the model based on observed conditions to improve the accuracy of our projections moving forward.This methodology is applicable today to existing aging concrete structures where the lifecycle projection can be calibrated to existing observed conditions and data from online monitoring and non-destructive examinations.
Figure 8. Crack Width Estimation Based on Reinforcement Strain
CONCLUSIONS Structural Integrity successfully developed expanded capabilities to model thermodynamics for the energy deposition and nitrogen cooling system. SI pushed the capabilities of our concrete model to capture over 30 years of construction and operations. Along the way, SI showed that our advanced modeling, combined with our advanced concrete model, positively influenced the design of the structure, and heavily supported the design and research teams with valuable information. The robustness of the calculation showed that SI is the present and future of concrete structure analysis.
SI demonstrated that our advanced modeling, combined with our advanced concrete model, positively influenced the design of this structure and heavily supported both the research and design teams with valuable information.
Figure 9. 2D Thermal Results of Decay Tunnel, Air Access Space, Shield Tunnel Walls, and Surrounding Soil
https://www.structint.com/wp-content/uploads/2023/01/News-Views-Volume-52-Forecasting-the-Life-of-a-Mass-Concrete-Structure-Part-Two.jpg363668Structural Integrityhttps://www.structint.com/wp-content/uploads/2023/05/logo-name-4-930x191-1.pngStructural Integrity2023-06-28 16:13:152023-06-29 15:35:19News & Views, Volume 52 | Forecasting the Life of a Mass Concrete Structure, Part Two
By: Kannan Subramanian, PhD, PE, FASME & Dan Parker, PE
BACKGROUND
The hot section of a waste heat boiler, also known as the hot spent boiler, is an essential component in the regeneration of spent sulfuric acid in chemical plants that process sulfur. Due to the ever-increasing demand for sulfuric acid and other sulfur compounds, this is critical equipment as its operation results in sold-out production. As a result, these boilers need maximum uptime between scheduled maintenance outages; any unscheduled shutdowns to repair and/ or replace tubes and tube sheets directly translate into lost revenues for the plant. This article addresses the reliability issues of one such boiler located in a Louisiana chemical plant.
GOAL: Predict the minimum number of tubes to plug, minimize downtime and allow regular operation until the next planned maintenance.
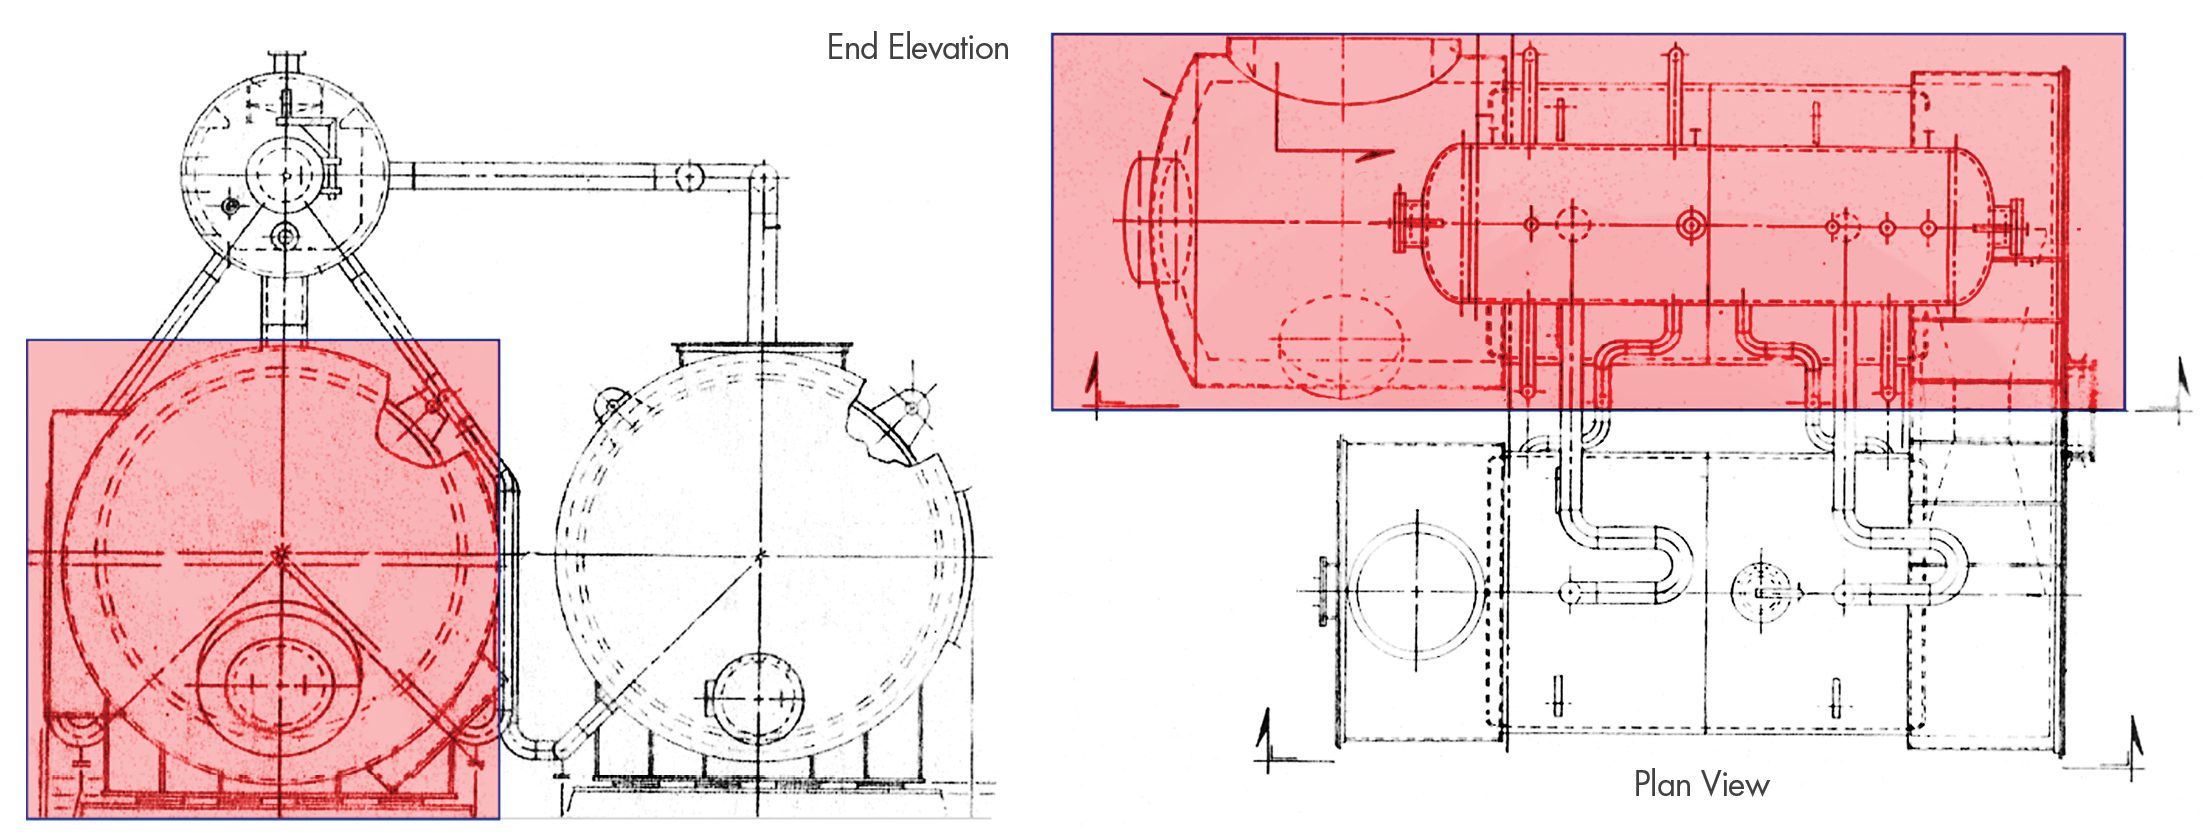
Figure 1. Hot Spent Boiler (shaded in red) in a waste heat recovery unit Flue Gas Tube Boiler.
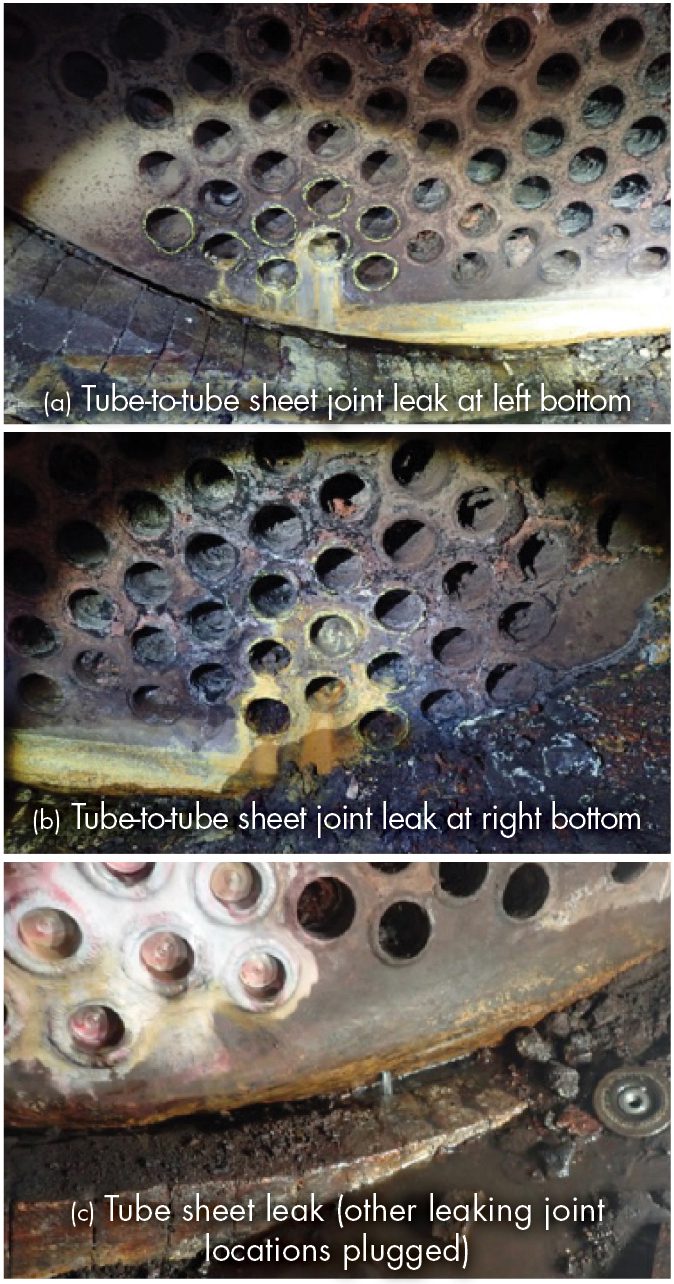
Figure 2. Tube-to-tube sheet joint failures and tube sheet leak
The boiler being assessed was part of an arrangement (Figure 1), with two fire tube boilers in parallel with a common external steam drum. In the case of the single boiler assessed by SI, the tubes were experiencing periodic tube leaks as the boiler was approaching the end of service life where tube failure frequency increases. As typical, there may be a single tube leak or several in the same proximity (Figure 2). Some proactive plugging has been applied based on historical performance (Figure 3(a)). In SI’s experience, tubes adjacent to a plugged tube may fail a short time after the plug is installed as there is an undefined temperature/stress interaction. In addition to tube leaks, general corrosion and tube sheet thinning can be a consequence of tube leaks (Figure 2(c). Excessive tube sheet thinning is not uncommon due to the formation of sulfuric acid that exacerbates the corrosion issue. With these consequences in mind, it is critical that the proper number of tubes be plugged to stop the costly cascade of failures.
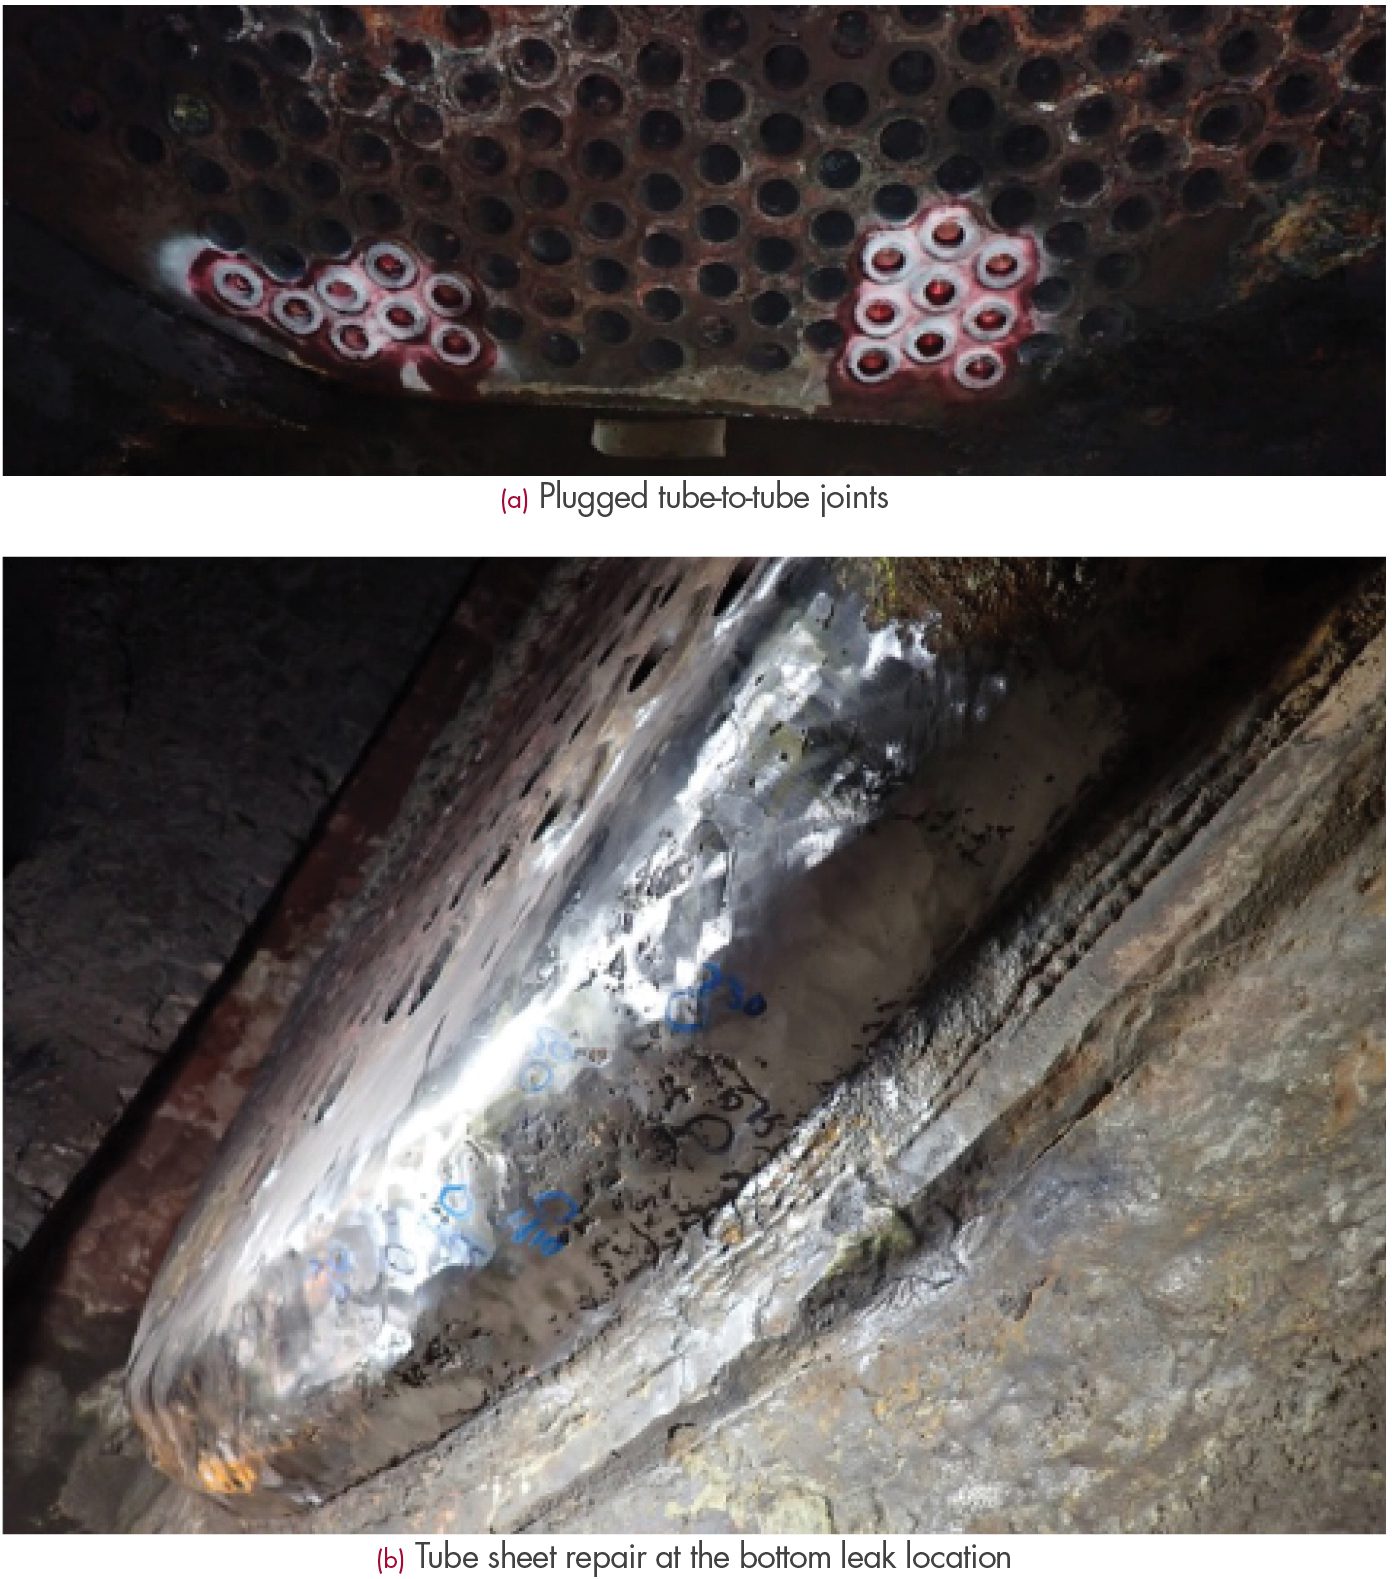
To bring the boiler back to service, in early January of 2022, the leaking tubes and a few other tubes around the leaking tubes were plugged. In addition, to repair the leaking location in the tube sheet knuckle region, welding followed by post-weld heat treatment was performed (Figure 3(b)). Within a few weeks after this repair, additional tube leaks were discovered and required plugging. Such frequent leaks and repairs result in production loss and unplanned expenses. To minimize those, SI was contracted to develop an engineering basis for tube plugging, which would be proactive for equipment reliability, but not produce over-plugging that affects the boiler heat duty. To achieve this, the engineering assessment should involve an advanced analytical study to understand the following:
Tube leaks
Effect of repair, PWHT, and additional plugging on adjacent unplugged tubes
Effect of tube sheet metal loss on the integrity of the tube sheet
This article covers both the historic details of the failures and subsequent repairs and provides a comparison of the failures documented on-site with the analytical results determined from the approach implemented by SI.
Figure 3. Hot Spent Boiler Plugging and Repair Welding
METHODOLOGY & CRITERIA
The overall approach adopted by SI:
Develop finite element (FE) model to study design deficiencies, if any, using elastic analyses. That is, perform an elastic finite element analysis (FEA).
Develop a criterion to study the tube-to-tube sheet integrity.
Using the same FE model, perform elastic-plastic analyses to determine the effect of repair and PWHT.
This is to determine if any additional tubes should be plugged to reduce any adverse effects.
This is a sequentially coupled thermal-stress analysis.
Calculate the minimum required thickness for the various sections of the waste heat boiler.
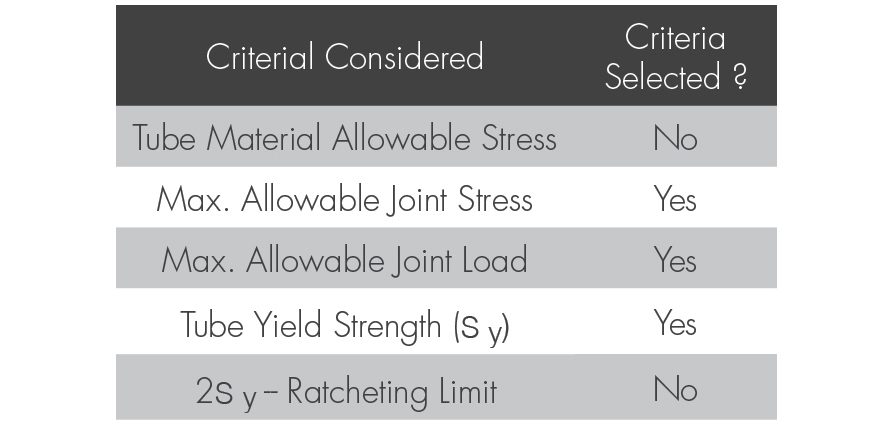
Table 1. Criteria Used in the Analyses
Table 1 illustrates the criteria considered for the work described herein. Several stress magnitudes were considered, such as the tube material allowable stress, tube-to-tube sheet joint allowable stress, and the ratcheting limit. Typically, when elastic analyses are performed, ratcheting limits are helpful. However, this work did not utilize the ratcheting limit. The tube-to-tube sheet joint allowable stress and load are calculated using Section VIII, Div. 1, Nonmandatory Appendix A. The allowable stress and load are compared against the equivalent stresses and tube axial loads, respectively, from the FEA to determine the mechanical integrity of the tube-to-tube sheet location. However, since there exists a parallel damage mechanism (general corrosion), the yield strength of the tube is set as a limit to add conservatism.
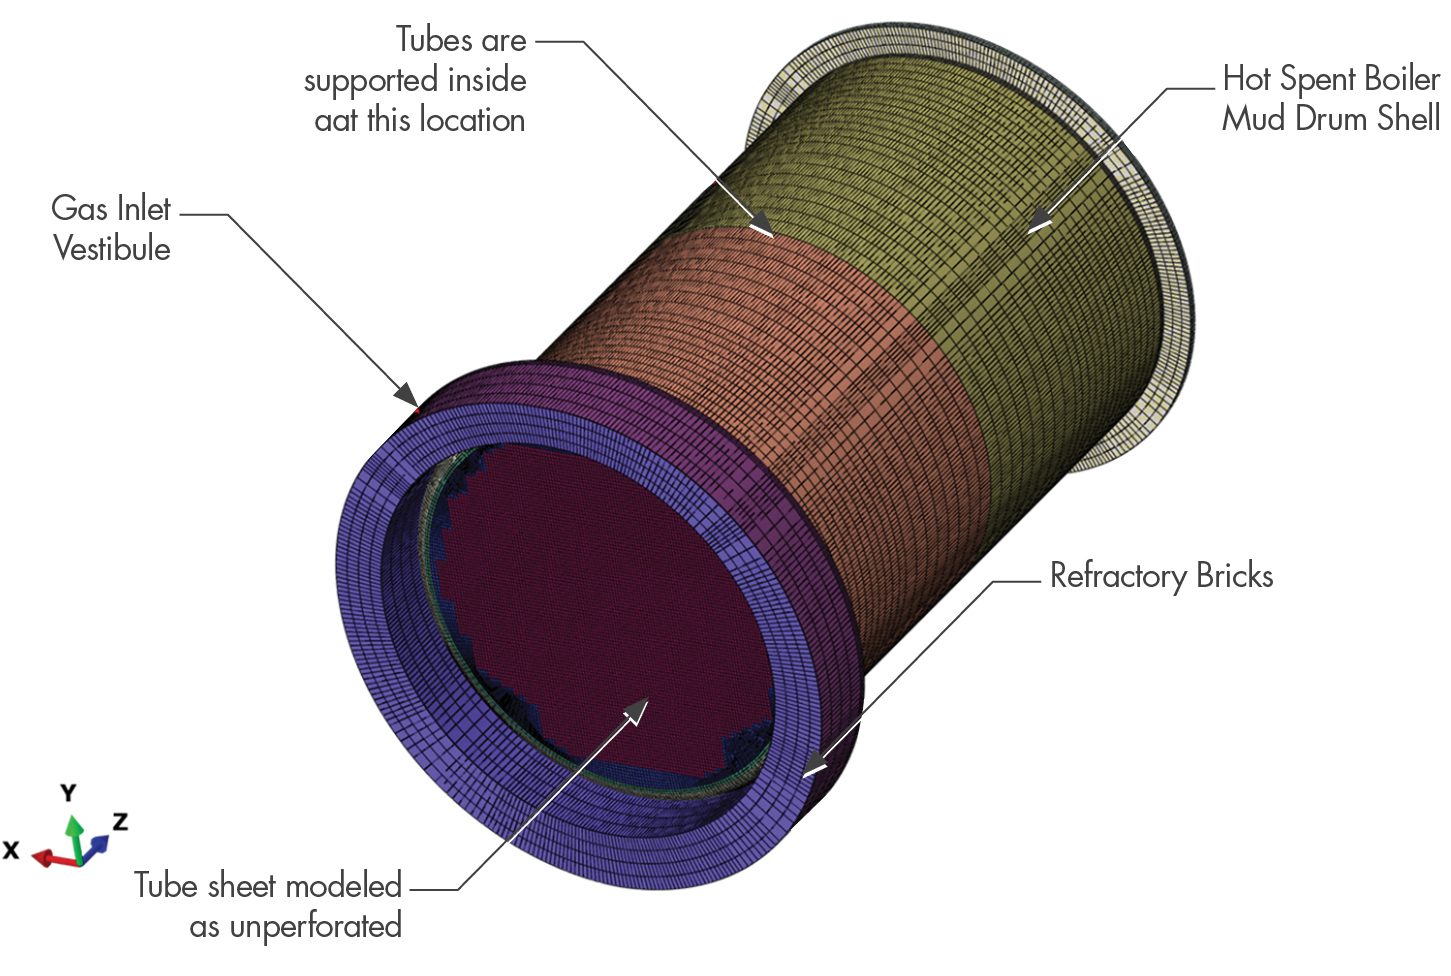
Figure 4. Hot Spent Boiler as Modeled in FEA
ANALYSES & RESULTS
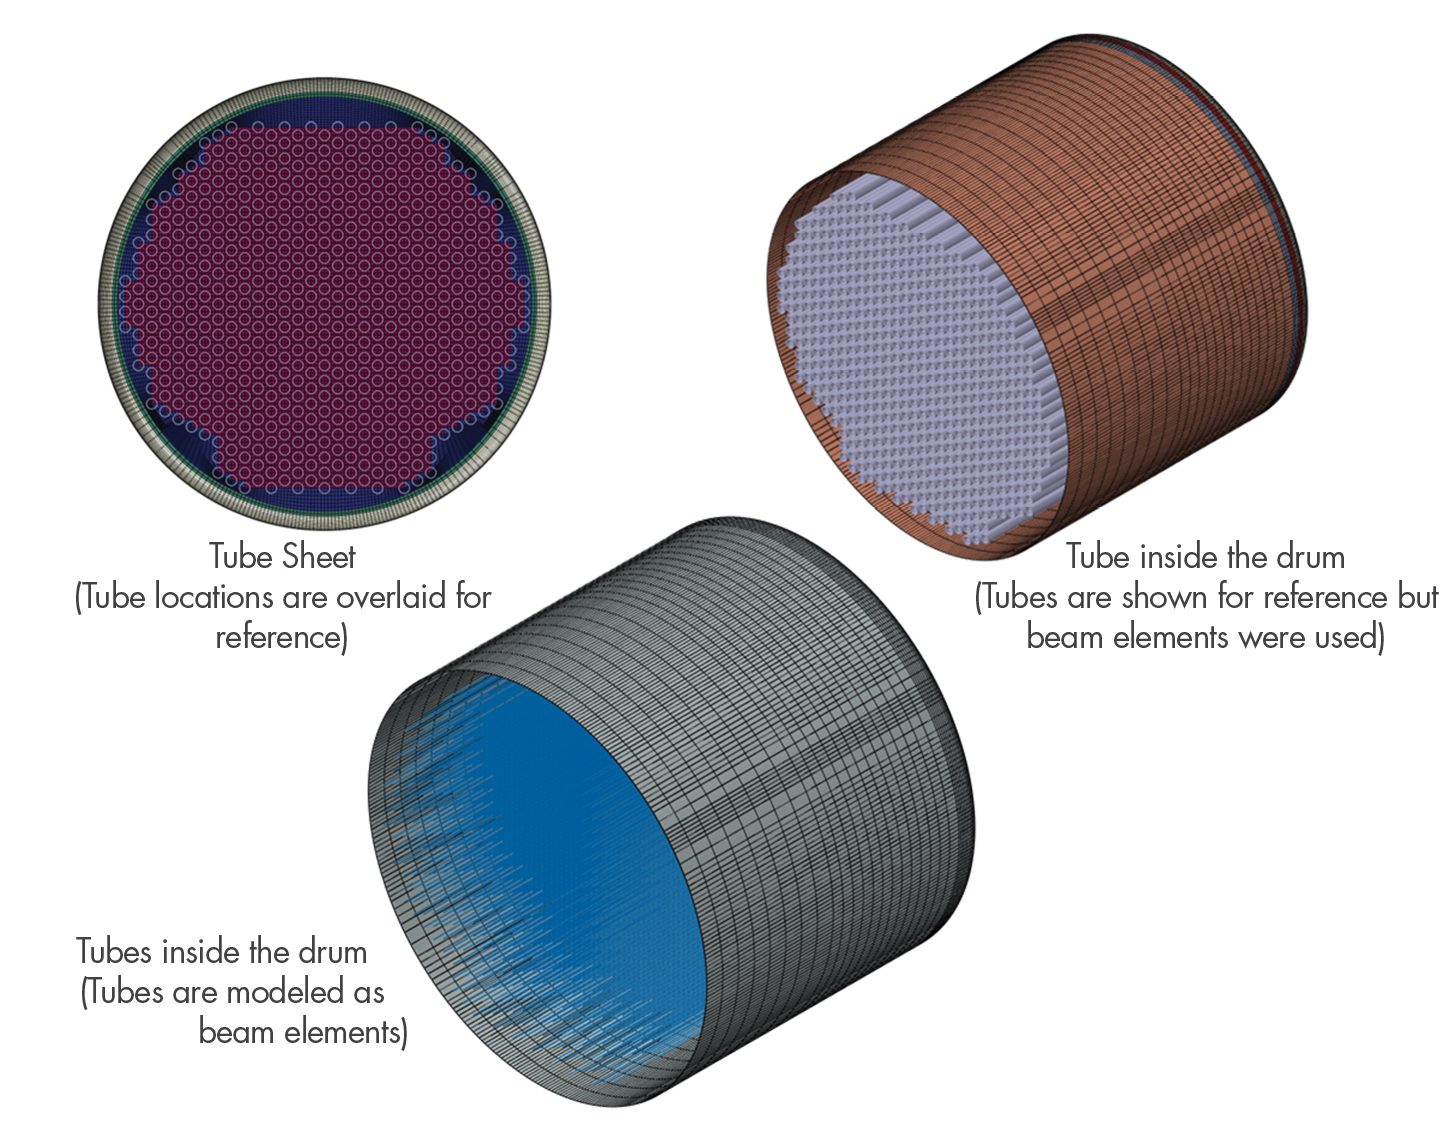
Since the methodology requires the use of advanced analytical methods, an FEA model (Figure 4) was built and analyzed using the commercial FEA software package – Abaqus. The model included sufficient lengths of gas inlet and outlet sections, the tube support location at the mid-section of the mud drum, the refractory, and the brackets that connect the hot section with the boiler drum. Since the nozzles are far from the area of interest, they are not included in the model. Appropriate element types were utilized for this work. One notable feature is the use of beam elements for the tubes (Figure 5). Since the model includes hundreds of tubes, incorporating a solid tube and heat exchanger model adds both geometric and numerical complexity. The use of beam elements simplifies the model while significantly minimizing the numerical convergence issues when compared with the full solid models.
Figure 5. Hot Spent Boiler Tubes Inside the FEA Model
All the analyses performed are thermo-mechanical analyses, wherein a heat transfer/thermal analysis is performed first, and the temperature profile from the thermal analysis is imposed along with respective mechanical loads in the subsequent stress/mechanical analysis. Initially, elastic models were used to assess the design adequacy of the subject boiler and to determine the bounding operating conditions for further analyses involving the repair process. For the analyses involving the weld repair and the post weld heat treatment (PWHT) followed by operating conditions, the sequence of steps is critical. SI discussed the methodology with the client when developing the accurate sequence to be included in the FEA. As stated earlier, to capture the effect of residual stresses (after welding and PWHT processes) on the corroded tube sheet section at the bottom where the leak was discovered, an elastic-plastic FEA is essential. Temperature results from the welding process step are shown in Figure 6. After welding and PWHT, the process conditions were applied to the model along with the number of plugged tubes at the time. Figure 7 illustrates the temperature distribution in the tube sheet, boiler drum, and tubes. Since the plugged tubes do not transport flue gas, the temperature of those tubes is the same as the water temperature around those tubes inside the drum.
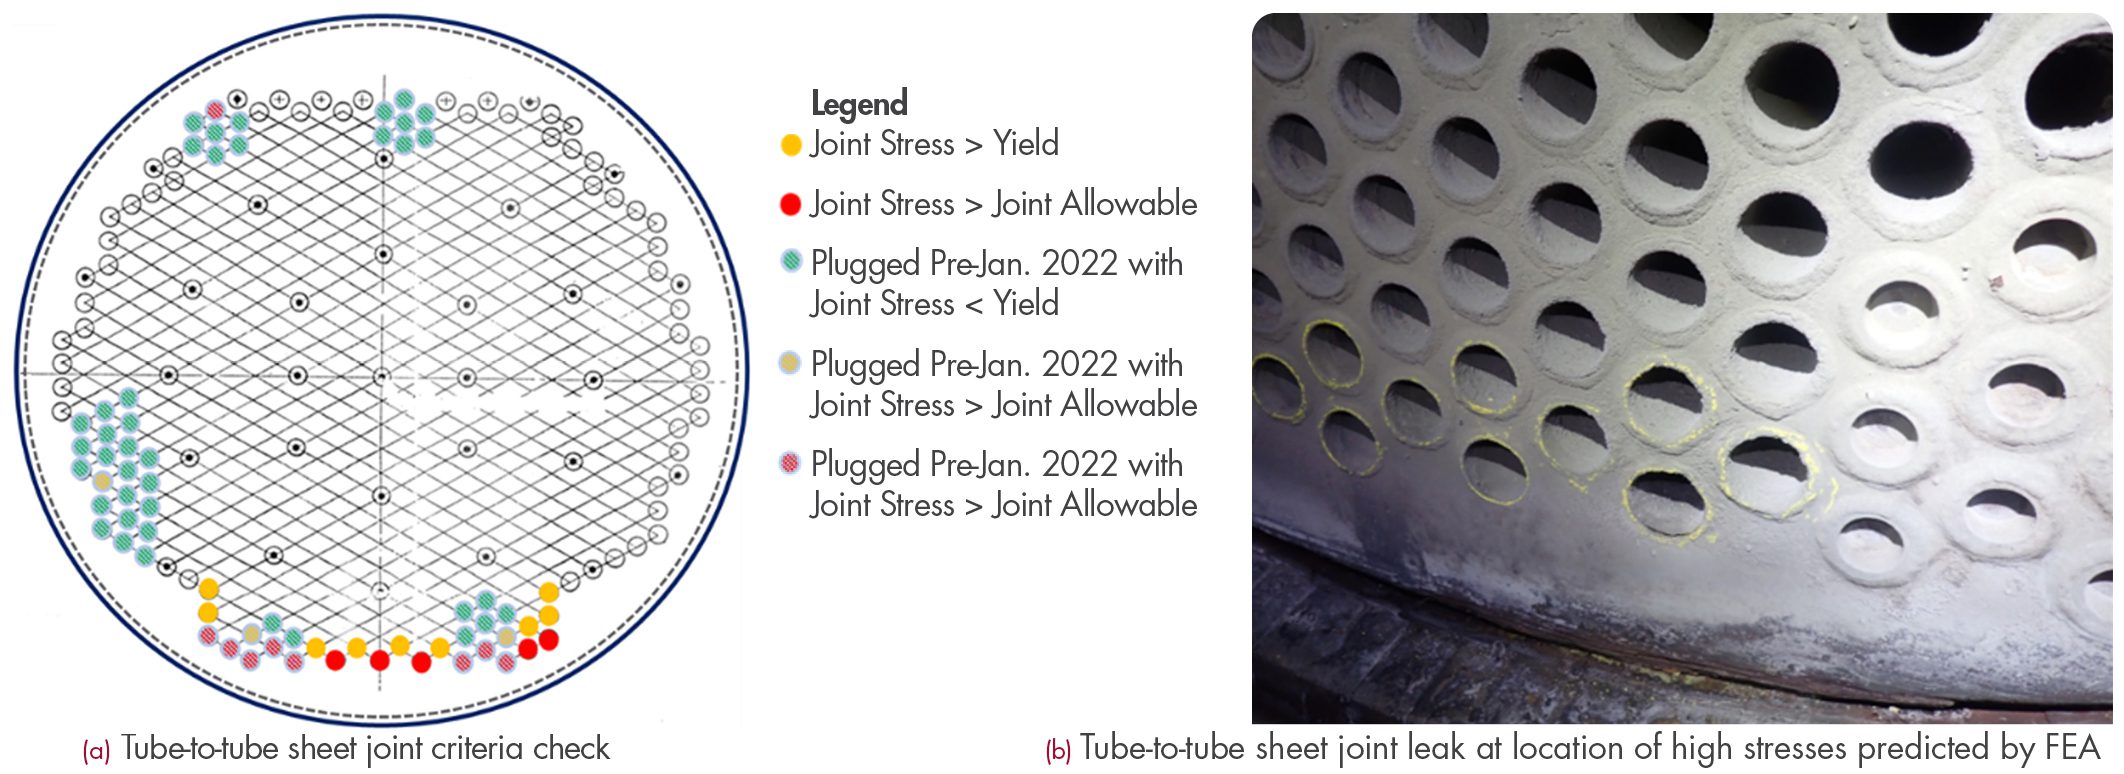
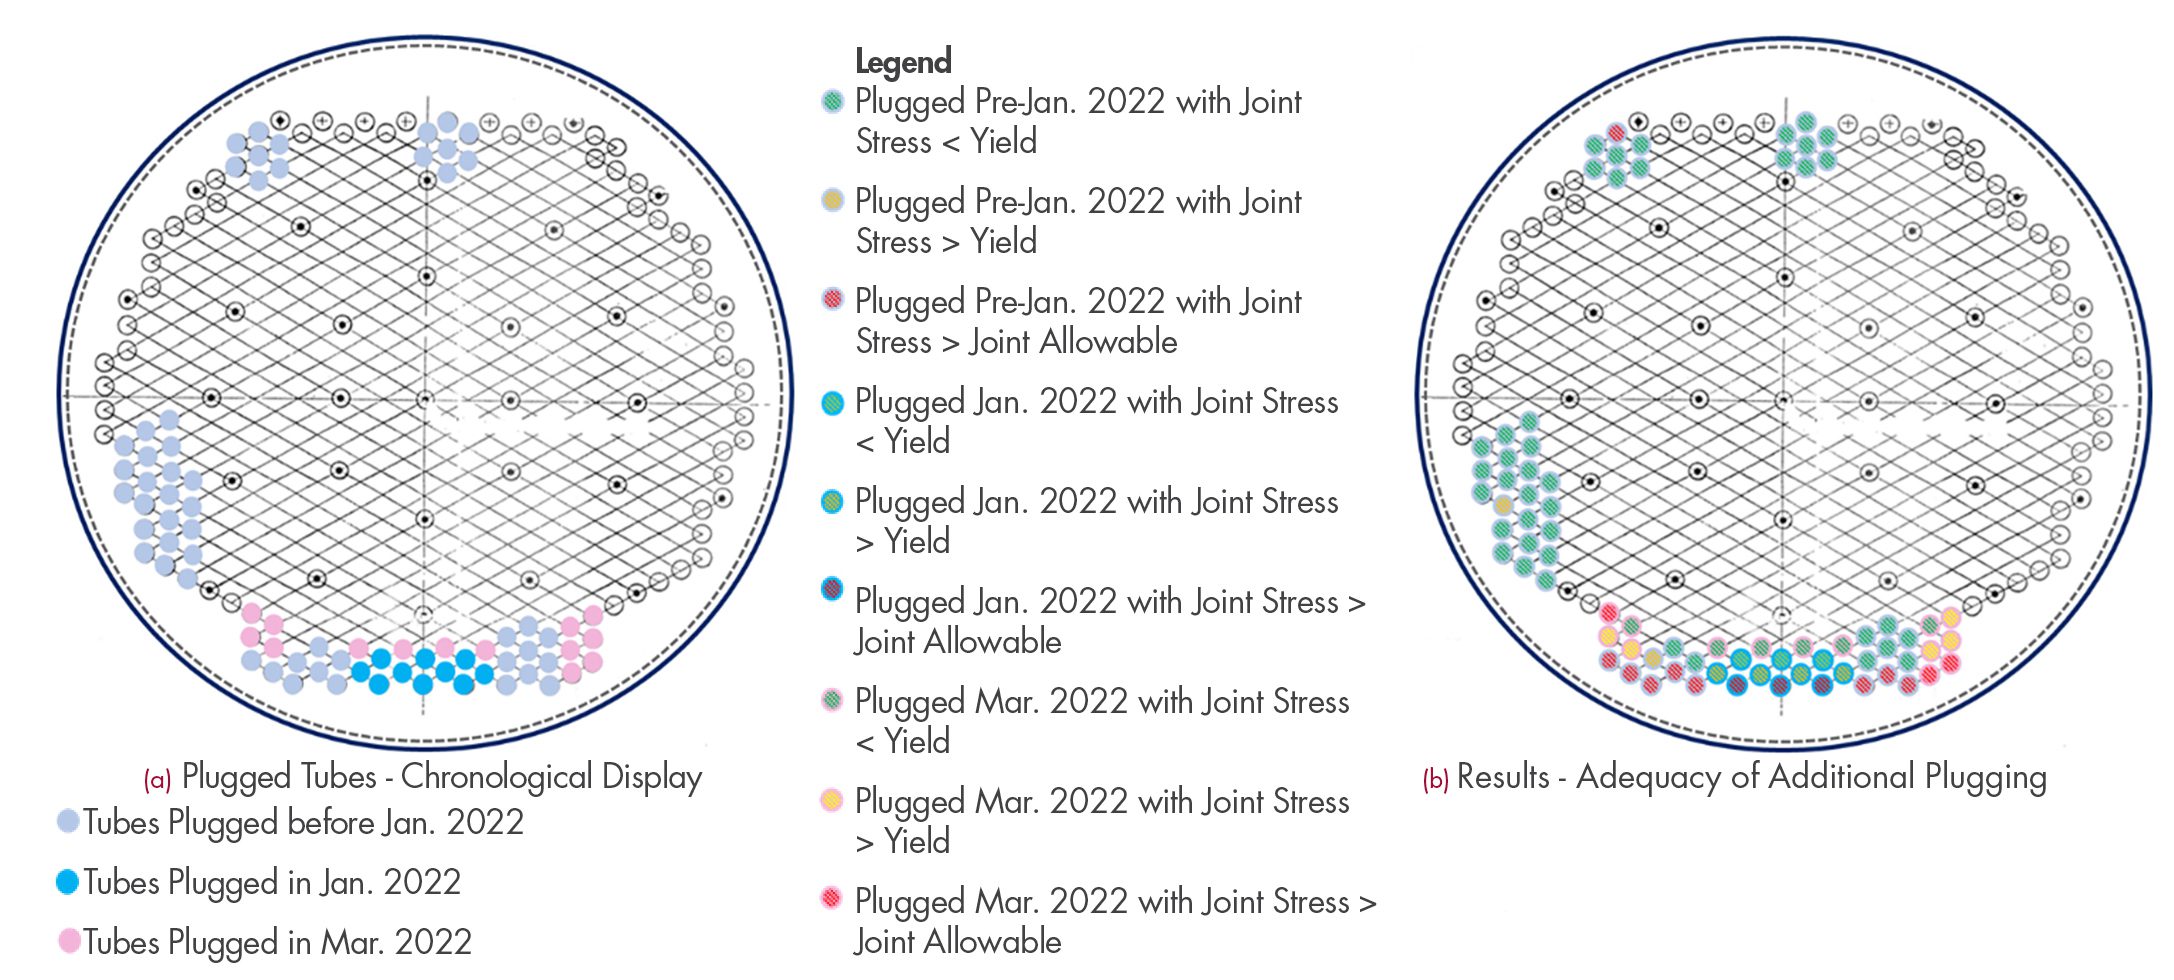
Since the number of tubes is significant, post-processing of results is a challenge. SI developed a procedure to overlay the von Mises equivalent stress results on a spreadsheet layout that resembles the actual tube layout in the tube sheet. It is further simplified for better visualization in this article, as shown in Figures 8 through 10. Figure 10 (a) shows a historical perspective of the tube plugging over time. In the first set of analyses that SI performed, only the locations shown with greyish blue color (tubes plugged before Jan. 2022) were considered as plugged. The thermal analysis results for this case are shown in Figure 7. After performing the mechanical/stress analysis, it was observed that the unplugged tube locations shown in Figure 8 (a) with orange and red dots are of concern. The orange dot locations indicate the locations with stresses greater than the tube yield strength. The red dot locations indicate that the stresses exceeded the allowable stress. Since the criteria are set at joint location stresses exceeding the tube allowable stresses, both orange and red dot locations require tube plugging. Figure 8 (b) shows the locations where further tube leaks were discovered within weeks of the weld repair and plugging. The tube leak locations are identified with yellow marks. This gives the confidence that such analytical methods, when appropriately applied, can predict the locations of future failures.
Figure 6. Repair Welding Simulation – Heat Transfer Analysis
Figure 7. Post Repair and Plugging Process Conditions – Heat Transfer Analysis
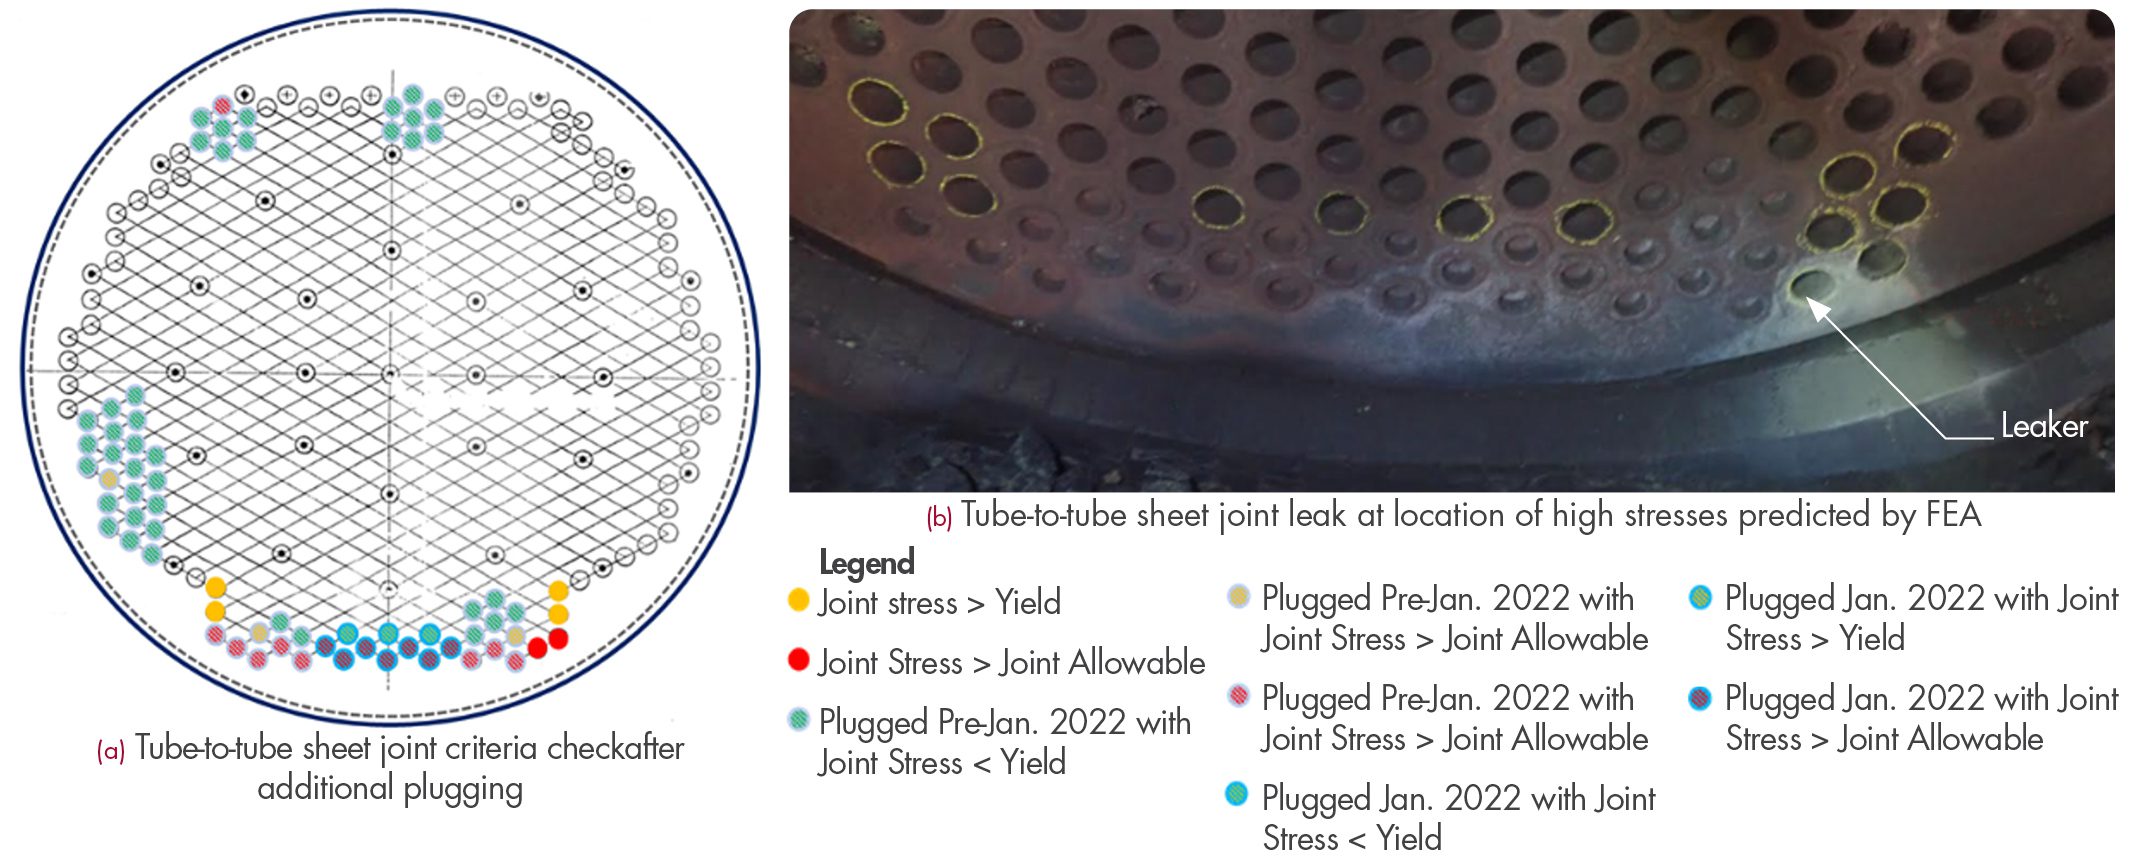
After the discovery of the new leaks, further plugging was undertaken. These locations are identified by light blue dots in Figure 10 (a). SI incorporated these changes in the analyses and determined that the locations shown in red and orange dots in Figure 8 (a) are still a concern, as shown in Figure 9 (a). This was later confirmed by further tube leaks (see Figure 9 (b)) found after 6 weeks of the previous plugging was completed. This further assured the value of performing such an engineering-based approach rather than a traditional grand-fathering approach which would use plugging methods adapted for similar units based on historical information. It should be noted that SI was engaged in this study at the period between weld repair and second set of plugging as shown in Figure 8. However, all the results were made available just prior to the third leak shown in Figure 9 (b). At this time, the Client utilized the results from the FEA and decided to add additional tube plugging as shown in Figure 10. SI performed analyses with the final set of plugging, and the results indicated that other tube locations around the plugged tube locations are not of concern (see Figure 10 (b)).
Figure 8. Post Repair and Plugging Process Conditions Criteria Check and Field Observation
Figure 9. Additional Plugging and Field Observation after that Plugging
The last set of analyses were performed in mid-March of 2022, and after 6 months, the boiler did not experience any further leaks. While the engineering approach predicted the issues, it is cautioned that any engineering analysis can only simulate the known degraded material thickness and properties in the analysis and not the corrosion degradation mechanism itself. The rate of deterioration and the interaction of various damage mechanisms should be monitored by the operator.
Figure 10. Tube plugging to-date and tube-to-tube sheet joint stress state
CONCLUSIONS
The original, as-installed condition did not show significant issues. It is believed that other damage mechanisms caused the initial failures leading to the plugging of tubes around the periphery of the tube sheet.
The study captured the recent joint issues, specifically the failure after the plugging and repair weld performed in early January 2022.
Thinner regions are more prone to further failure. The minimum required thickness using the same criteria is established for the tube sheet.
The analysis was successful in predicting the minimum number of tubes to plug.
Plugging the correct number of tubes stopped the typical tube failure cascade.
The applied results were directly proven. Once the results were fully implemented, the waste heat boiler had no unplanned shutdowns. The analysis met its goal and provided a major business impact.
Analysts need sufficient information to minimize assumptions and make a robust model.
Clear understanding of API 579, ASME Section VIII Div. 1, ASME Section I, and FEA is necessary to develop robust, realistic, and relevant engineering solutions.
By: Scott Riccardella, Owen Malinowski & Dr. Pete Riccardella
Structural Integrity Associates is focused on evaluating the impact of hydrogen blending on pipeline integrity and establishing a roadmap for our clients to maintain the safety and integrity of their aging natural gas steel transmission pipelines.
Hydrogen is widely recognized as a viable, clean alternative energy carrier. Recent advances in technology for clean hydrogen production, as well as renewed governmental and organizational commitments to clean energy, have intensified interest in utilizing the existing natural gas pipeline infrastructure to transport hydrogen from production sites to end users. Energy companies are pursuing strategic pilot programs to evaluate the capacity of their natural gas transmission and distribution pipeline systems to safely transport blends of natural gas and hydrogen. These pilot programs demonstrate the commitment of energy companies to facilitate environmentally responsible energy production and consumption while identifying and investigating potential challenges to pipeline safety and integrity associated with hydrogen blending.
KEY ELEMENTS OF THE EVALUATION INCLUDE
Completing a critical threat review using a phenomena identification and ranking table (PIRT) process with a team of experts.
Developing a statistical model for evaluating accelerated fatigue crack growth (FCG) in a hydrogen blend environment.
Developing a statistical model for evaluating reduced fracture resistance (hydrogen embrittlement).
Analyzing the impact of FCG and hydrogen embrittlement on the probability of rupture (POR) due to key threats such as stress corrosion cracking (SCC), longitudinal seam weld defects, and hard spots.
Implementing a joint industry project (JIP) to adapt SI’s APTITUDE software tool for evaluating predicted failure pressure (PFP) and remaining life resulting from SCC and FCG in a hydrogen blend environment.
CRITICAL THREAT REVIEW As part of a systemwide evaluation for one of our clients, a large North American Pipeline Operator, a critical threat review using a PIRT process was conducted to comprehensively understand the potential impact of hydrogen blending on steel natural gas transmission pipeline integrity. To ensure a thorough and accurate PIRT was completed, a panel consisting of experts in metallurgy, fracture mechanics, hydrogen effects on steel properties, and pipeline operations was assembled. A vital part of the process was a series of meetings conducted with the pipeline operator, systematically identifying and ranking the importance of various phenomena that could adversely affect the safety and reliability of energy transportation through the operator’s existing transmission pipeline system.
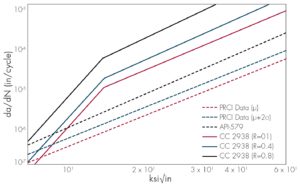
Figure 1. FCG rate curves in hydrogen (solid lines) versus air (dashed lines).
The PIRT panel reviewed all known pipeline integrity threats and identified potential unknown or unexpected threats that could be influenced by the presence of hydrogen in the operator’s transmission pipeline system. The process also assigned priorities for future research that may be needed to support that objective.
ENHANCED FATIGUE CRACK GROWTH Significant research exists on the effect of hydrogen on FCG of pipeline steels and was referenced in this exercise. To gather the most relevant information possible, the project team compiled and analyzed data from numerous client-specific FCG tests of samples taken from the pipeline system in the targeted environment. These sample systems were exposed to equivalent hydrogen blend levels of 5%, 10%, 20%, and 100%. Over 2,200 data points were compiled and analyzed to develop trend curves and associated statistical variability. Data exhibited a significant increase in FCG rates (Figure 1) at relatively low hydrogen blend levels. ASME Code Case 2938 was reviewed and empirically fit with the analyzed data.
Figure 2. Fracture toughness reduction as a function of hydrogen partial pressure for different pipe grades.
HYDROGEN EMBRITTLEMENT Hydrogen is known to have an embrittling effect on carbon steels, such as those used in gas transmission pipelines. When an internal pipe surface is exposed to high-pressure hydrogen or a high-pressure mixture of hydrogen and natural gas, hydrogen gas can disassociate into hydrogen atoms, which can then be adsorbed into the steel and lead to material property degradation (such as reduced fracture resistance). Dislocations and defects in the steel can also act as hydrogen traps, leading to even higher hydrogen concentrations at the location of already vulnerable manufacturing defects and service-induced cracks. Reduced fracture resistance at such sites could increase the adverse effect on pipeline integrity by leading to more frequent pipe failure events.
Based on available data from the literature and input from the PIRT expert panel, the project team developed trend curves of percent reductions in fracture resistance due to hydrogen exposure (knockdown factors) relative to fracture toughness in air. From this analysis, a reasonably conservative approximation, including statistical variability, was developed for the region of interest (hydrogen/natural gas blend levels up to 20% – Figure 2). Additional research and data analysis are currently underway that may further validate the relationship and better study this effect at low hydrogen partial pressures, as well as confirm the knockdown effect on lower toughness pipeline materials, such as electric resistance welded (ERW) seam welds.
PROBABILISTIC FRACTURE MECHANICS SI has developed Synthesis™, a Probabilistic Fracture Mechanics (PFM) tool that calculates the probability of rupture (POR) for various cracks and crack-like defects that have caused oil and gas pipeline failures. The software incorporates statistical distributions of all important parameters in a pipeline fracture mechanics calculation that uses a Monte Carlo analysis algorithm that randomly samples from each distribution and runs millions of simulations to estimate the probability of rupture versus time. To evaluate the impact of hydrogen blending, Synthesis has been adapted to incorporate the effects of hydrogen on pipeline steel properties (enhanced FCG and hydrogen embrittlement) and thus the ability to compare PORs with and without hydrogen blending. The modified software was then applied to several pipelines in the operator’s system to determine the POR ratio between various hydrogen blend levels and pure natural gas. Additionally, Synthesis can evaluate the effects of various mitigation measures, such as hydrotests and In-Line Inspections, that could be applied before injecting hydrogen (Figure 3). The calculated PORRs will allow the operator to prioritize pipelines and associated mitigating actions that may be more or less favorable for hydrogen blending.
Figure 3. Improvement in POR and PORR for different integrity assessments.
APTITUDE™ JOIN INDUSTRY PROJECT SI has also established a JIP to adapt the APTITUDE PFP software program to handle some additional challenges presented with blending hydrogen with natural gas. Advancements include modifications that address enhanced FCG and hydrogen embrittlement. Further research to close gaps identified during the PIRT process is also being pursued through PRCI and other forums. Availability to join the JIP still exists, but space is limited – Please contact us if you would like to participate.
DEVELOPMENT FOR TRISO FUEL AND ADVANCED REACTOR APPLICATIONS
By: Bill Lyon
The Pegasus code allows the user to develop more realistic models of fuel behavior by utilizing an innovative 3D framework that delivers a more detailed and rigorous solution. This solution allows the user to remove conservative assumptions, simplifications, and uncertainties resulting from 2D or 1D simplified/empirical solutions.
Figure 1. A PEGASUS TRISO fuel particle model and mesh showing geometry and composition
Remove the conservativism and start using the calculated operational margins to increase efficiencies and reduce the capital outlay for refueling.
QUICK FACTS
Independently developed 3D FEM code; fuel vendor independent code provides best-estimate performance modeling
Focused on fuel structure
Provides high-fidelity results
Addresses existing fuel performance
Aids in the development of advanced fuel designs
Ready for Gen IV Reactors and TRISO Fuels
BENEFITS REALIZED
Reduced conservatism
Increased efficiencies
Potential for significant fuel cost savings
INTRODUCTION The PEGASUS nuclear fuel behavior code is a robust 3D, finite element modeling (FEM) computational software platform capable of thermo-mechanical and structural non-linear analyses of nuclear fuel and reactor components. Focused initially on light water reactor (LWR) fuels and materials, PEGASUS is being adapted and applied to a broader range of emerging industry priorities for proposed Gen IV (Generation IV) advanced reactor designs such as high-temperature gas (HTGRs) and molten salt-cooled reactors (MSRs). These applications require modeling various fuel forms, geometries, and materials such as high assay, low enrichment uranium (HALEU), advanced cladding alloys, and other fuels with integrated containment such as tri-structural isotropic (TRISO) fuel particles and encapsulated particle fuel types. PEGASUS is perfectly positioned to evaluate these challenging structures with realistic modeling and simulation results.
TRISO-BASED FUELS AND MATERIALS DEVELOPMENT One of the significant efforts underway in the continued development of PEGASUS is the introduction of material constitutive and behavioral models for TRISO fuel and the materials that comprise this fuel form. The initial research on the needed material property and behavior model data comes from a variety of sources, including the Department of Energy’s (DOE’s) Advanced Gas Reactor (AGR) fuel development and qualification experimental program [1] and numerous DOE-supported modeling efforts such as those from Hales et al. [2,3]. In parallel to those efforts, geometric modeling and meshing techniques specifically designed to address the complex TRISO fuel geometric configurations are being explored and developed. These exploit the CAD-like modeling environment and the already available automated meshing tools and capabilities in PEGASUS.
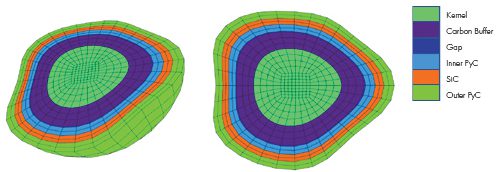
TRISO fuel forms are comprised of multi-layered particles embedded into fuel compacts of various compositions and shapes. The TRISO particle layers are designed to encapsulate and contain the nuclear fuel and the fission products produced during operation. It is this characteristic that creates the robust nature of TRISO-based fuels. The fuel particles are typically composed of a fuel kernel, such as uranium oxycarbide (UCO), surrounded by layers of 1) a porous carbon buffer, 2) an inner pyrolytic carbon (PyC) shell, 3) a silicon carbide (SiC) layer, and 4) an outer PyC shell. The orientation and relative thicknesses of these layers are shown in Figure 1, which depicts a basic PEGASUS TRISO particle model.
Material constitutive models have been developed for UCO fuel, porous and pyrolytic carbon, and SiC and are currently being tested for application in PEGASUS.
TRISO FUEL CONFIGURATIONS AND MODELING DEVELOPMENT
In addition to conventional FEM-based modeling and meshing capabilities, PEGASUS also contains several tools explicitly designed to facilitate advanced reactor and fuel analysis. These include: 1) a 3D and hybrid 2D/3D meshing capability to optimize computational efficiency (currently under development), 2) a “spherical mesh object” tool to generate 3D/2D spheres and embedded spheres for modeling TRISO and fully encapsulated TRISO fuel forms, and 3) a “spiral extrusion” tool which can generate complex, spiral 3D fuel geometries and meshes such as those required for helical multi-lobed advanced fuel designs.
The spherical mesh object and spiral extrusion tools are unique to PEGASUS and, to our knowledge, not found in any other fuel performance or general-purpose FEM code.
Figure 2. Example TRISO particle distribution: (a) micrograph of a TRISO fuel compact (adapted from Nelson [5]), (b) random particle distribution pattern algorithm output.
Figure 3. Cross-sectional view of embedded TRISO particles in a 3D fuel compact matrix.
These modeling capabilities allow PEGASUS to be used to investigate very detailed mechanical and structural effects in highly complex fuel forms. For example, the mechanical interaction between TRISO fuel layers, including the effects of cracking, debonding, and asphericity, can be modeled explicitly. Future work is planned to integrate damage-mechanics modeling capability into PEGASUS that is specifically applicable to TRISO-based fuels.
Given the complexity of typical TRISO fuel forms, another critical aspect for analysis is the development of a consistent methodology for generating configurations that mimic the distribution of TRISO particles in a fuel matrix. A technique has been developed based on a “passive randomization method” originated by Sukharev [4] that yields distribution patterns approximating those of TRISO fuels observed during fuel examinations. An example of an early application of this technique is shown in Figure 2, which compares a fuel micrograph to a generated TRISO particle configuration pattern.
For application in PEGASUS, geometric configurations such as shown in Figure 2b are converted into 2D and 3D FEM meshes with TRISO kernels embedded in meshed substrates using automated tools. Models such as these can provide the bases for computational studies of TRISO fuel performance, from detailed kernel multilayer response to interactions between multiple kernels and their surrounding matrix. Several examples of TRISO meshes generated with PEGASUS are shown in Figures 3, 4, and 5. Figure 3 illustrates the cross-section of a 3D TRISO fuel compact with embedded TRISO particles. The appearance of multiple particle sizes is an indication of varying particle depths within the matrix. This figure was generated using the spherical object meshing tool in PEGASUS.
Figure 4. Cross section of an array of discrete 3D TRISO particles embedded into a graphite compact pellet.
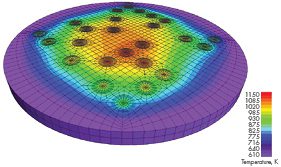
A more complex 3D model of encapsulated TRISO particles is shown in Figure 4. This model features a sparse particle distribution generated using the randomization technique applied in Figure 2b coupled with 3D automated meshing capabilities. This model was meshed in PEGASUS using an automated scripting tool and tested early in the development project using simplified approximations of thermal and mechanical properties of the kernel and matrix materials. Boundary conditions simulating prototypic gas reactor conditions were used in the simulation. Figure 5 shows the plotted temperature distribution from a portion of the model in figure 4.
Figure 5. Temperature distribution in a cross-section of a 3D slab of a TRISO compact matrix model under prototypic gas-cooled reactor conditions.
Further development of the TRISO fuel modeling capabilities in PEGASUS is ongoing. Detailed 3D modeling of TRISO kernels with irregular geometries such as non-uniform thicknesses and shapes in the pyrolytic carbon and SiC layers has been identified as a high priority as we advance. Additional priorities for future development include 1) implementation of mechanistically based, deterministic TRISO kernel and fuel compact failure models integrated into the material constitutive relations and 2) the calculation and tracking of fission product species diffusion and concentrations which incorporate the effects of chemical interactions, kernel layer, and substrate cracking.
SUMMARY The PEGASUS nuclear fuel behavior code is an advanced, independently developed 3D FEM computational software program capable of conducting complex, coupled thermo-mechanical and structural non-linear analyses. The role of PEGASUS is envisioned as complementary to existing regulatory-based assessment and licensing tools, where there is a need to address conservatism, perform an independent assessment, or provide additional fidelity to laboratory-sponsored research where wider materials, phenomena, or fidelity is needed. Current development activity is focused on application to proposed GEN IV advanced reactor designs featuring unique fuel materials and design configurations such as TRISO-based ceramic fuels to be deployed in HTRGs and MSRs. Future development work on PEGASUS will continue along multiple avenues, emphasizing TRISO constitutive and deterministic failure model development, implementation, and modeling. In summary, PEGASUS provides high fidelity and independent advanced analysis capability that can be used to address existing fuel performance. It allows for less conservatism and accelerates the development, design, and regulatory processes for new fuel concepts and advanced fuel designs such as those employing TRISO-based fuels.
References
D. A. PETTI, G. BELL, and the AGR Team, “The DOE Advanced Gas Reactor (AGR) Fuel Development and Qualification Program,” INEEL/CON-04-02416, 2005 International Congress on Advances in Nuclear Power Plants, May 15-19, 2005.
J. D. HALES et al., “Multidimensional Multiphysics simulation of TRISO particle fuel,” J. Nucl. Mat. 443 (2013) 531-543.
J. D. HALES et al. “BISON TRISO Modeling Advancements and Validation to AGR-21 Data,” INL/EXT-20-59368, September 2020.
A. G. SUKHAREV, Optimal strategies of the search for an extremum, U.S.S.R. Computational Mathematics and Mathematical Physics, 11(4), 1971.
A. T. NELSON, Features that Further Performance Limits of Nuclear Fuel Fabrication: Opportunities for Additive Manufacturing of Nuclear Fuels, ORNL/SPR-2019/1183, May 2019.
We may request cookies to be set on your device. We use cookies to let us know when you visit our websites, how you interact with us, to enrich your user experience, and to customize your relationship with our website.
Click on the different category headings to find out more. You can also change some of your preferences. Note that blocking some types of cookies may impact your experience on our websites and the services we are able to offer.
Essential Website Cookies
These cookies are strictly necessary to provide you with services available through our website and to use some of its features.
Because these cookies are strictly necessary to deliver the website, refusing them will have impact how our site functions. You always can block or delete cookies by changing your browser settings and force blocking all cookies on this website. But this will always prompt you to accept/refuse cookies when revisiting our site.
We fully respect if you want to refuse cookies but to avoid asking you again and again kindly allow us to store a cookie for that. You are free to opt out any time or opt in for other cookies to get a better experience. If you refuse cookies we will remove all set cookies in our domain.
We provide you with a list of stored cookies on your computer in our domain so you can check what we stored. Due to security reasons we are not able to show or modify cookies from other domains. You can check these in your browser security settings.
Google Analytics Cookies
These cookies collect information that is used either in aggregate form to help us understand how our website is being used or how effective our marketing campaigns are, or to help us customize our website and application for you in order to enhance your experience.
If you do not want that we track your visit to our site you can disable tracking in your browser here:
Other external services
We also use different external services like Google Webfonts, Google Maps, and external Video providers. Since these providers may collect personal data like your IP address we allow you to block them here. Please be aware that this might heavily reduce the functionality and appearance of our site. Changes will take effect once you reload the page.
Google Webfont Settings:
Google Map Settings:
Google reCaptcha Settings:
Vimeo and Youtube video embeds:
Other cookies
The following cookies are also needed - You can choose if you want to allow them:
Privacy Policy
You can read about our cookies and privacy settings in detail on our Privacy Policy Page.


 Structural Integrity Associates, Inc. (SIA) is pleased to announce the appointment of