By: Daniel Peters (SI) and Thomas Pastor (HSB Global Inspection & Engineering Services)

A recent news story reported:
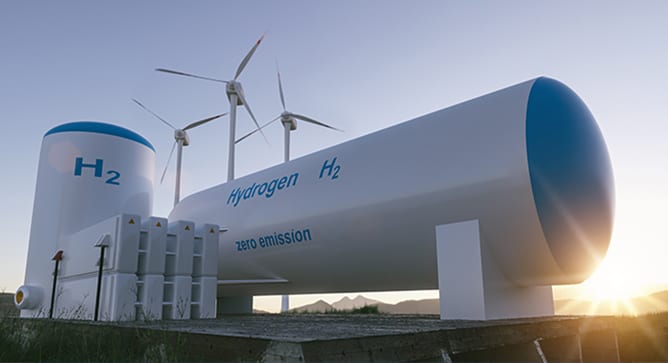
- Hydrogen initiatives are accelerating globally.
- 200+ large-scale projects have been announced across the value chain, with a total value exceeding $300 billion
- 30+ countries have national hydrogen strategies in place, and public funding is growing
Anyone who is following climate change issues and the expansion of the use of renewable energy would have seen the subject hydrogen popping up all over the place. Just do a Google search using the following words “hydrogen renewable energy climate change” and dozens of links will be displayed promoting the use of green or renewable hydrogen, made from the electrolysis of water powered by solar or wind, as indispensable in achieving climate neutrality.
. . . To continue reading, please download the full issue.