News & Views, Volume 52 | Understanding the Effects of Hydrogen Blending on Pipeline Integrity
OIL & GAS SAFETY & RELIABILITY
By: Scott Riccardella, Owen Malinowski & Dr. Pete Riccardella
Structural Integrity Associates is focused on evaluating the impact of hydrogen blending on pipeline integrity and establishing a roadmap for our clients to maintain the safety and integrity of their aging natural gas steel transmission pipelines.
Hydrogen is widely recognized as a viable, clean alternative energy carrier. Recent advances in technology for clean hydrogen production, as well as renewed governmental and organizational commitments to clean energy, have intensified interest in utilizing the existing natural gas pipeline infrastructure to transport hydrogen from production sites to end users. Energy companies are pursuing strategic pilot programs to evaluate the capacity of their natural gas transmission and distribution pipeline systems to safely transport blends of natural gas and hydrogen. These pilot programs demonstrate the commitment of energy companies to facilitate environmentally responsible energy production and consumption while identifying and investigating potential challenges to pipeline safety and integrity associated with hydrogen blending.
KEY ELEMENTS OF THE EVALUATION INCLUDE
- Completing a critical threat review using a phenomena identification and ranking table (PIRT) process with a team of experts.
- Developing a statistical model for evaluating accelerated fatigue crack growth (FCG) in a hydrogen blend environment.
- Developing a statistical model for evaluating reduced fracture resistance (hydrogen embrittlement).
- Analyzing the impact of FCG and hydrogen embrittlement on the probability of rupture (POR) due to key threats such as stress corrosion cracking (SCC), longitudinal seam weld defects, and hard spots.
- Implementing a joint industry project (JIP) to adapt SI’s APTITUDE software tool for evaluating predicted failure pressure (PFP) and remaining life resulting from SCC and FCG in a hydrogen blend environment.
CRITICAL THREAT REVIEW
As part of a systemwide evaluation for one of our clients, a large North American Pipeline Operator, a critical threat review using a PIRT process was conducted to comprehensively understand the potential impact of hydrogen blending on steel natural gas transmission pipeline integrity. To ensure a thorough and accurate PIRT was completed, a panel consisting of experts in metallurgy, fracture mechanics, hydrogen effects on steel properties, and pipeline operations was assembled. A vital part of the process was a series of meetings conducted with the pipeline operator, systematically identifying and ranking the importance of various phenomena that could adversely affect the safety and reliability of energy transportation through the operator’s existing transmission pipeline system.
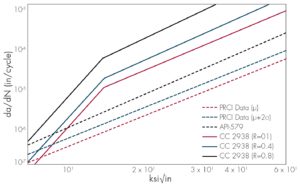
Figure 1. FCG rate curves in hydrogen (solid lines) versus air (dashed lines).
The PIRT panel reviewed all known pipeline integrity threats and identified potential unknown or unexpected threats that could be influenced by the presence of hydrogen in the operator’s transmission pipeline system. The process also assigned priorities for future research that may be needed to support that objective.
ENHANCED FATIGUE CRACK GROWTH
Significant research exists on the effect of hydrogen on FCG of pipeline steels and was referenced in this exercise. To gather the most relevant information possible, the project team compiled and analyzed data from numerous client-specific FCG tests of samples taken from the pipeline system in the targeted environment. These sample systems were exposed to equivalent hydrogen blend levels of 5%, 10%, 20%, and 100%. Over 2,200 data points were compiled and analyzed to develop trend curves and associated statistical variability. Data exhibited a significant increase in FCG rates (Figure 1) at relatively low hydrogen blend levels. ASME Code Case 2938 was reviewed and empirically fit with the analyzed data.
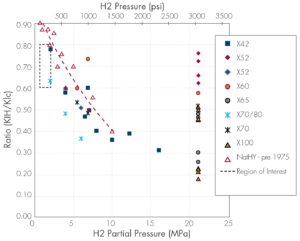
Figure 2. Fracture toughness reduction as a function of hydrogen partial pressure for different pipe grades.
HYDROGEN EMBRITTLEMENT
Hydrogen is known to have an embrittling effect on carbon steels, such as those used in gas transmission pipelines. When an internal pipe surface is exposed to high-pressure hydrogen or a high-pressure mixture of hydrogen and natural gas, hydrogen gas can disassociate into hydrogen atoms, which can then be adsorbed into the steel and lead to material property degradation (such as reduced fracture resistance). Dislocations and defects in the steel can also act as hydrogen traps, leading to even higher hydrogen concentrations at the location of already vulnerable manufacturing defects and service-induced cracks. Reduced fracture resistance at such sites could increase the adverse effect on pipeline integrity by leading to more frequent pipe failure events.
Based on available data from the literature and input from the PIRT expert panel, the project team developed trend curves of percent reductions in fracture resistance due to hydrogen exposure (knockdown factors) relative to fracture toughness in air. From this analysis, a reasonably conservative approximation, including statistical variability, was developed for the region of interest (hydrogen/natural gas blend levels up to 20% – Figure 2). Additional research and data analysis are currently underway that may further validate the relationship and better study this effect at low hydrogen partial pressures, as well as confirm the knockdown effect on lower toughness pipeline materials, such as electric resistance welded (ERW) seam welds.
PROBABILISTIC FRACTURE MECHANICS
SI has developed Synthesis™, a Probabilistic Fracture Mechanics (PFM) tool that calculates the probability of rupture (POR) for various cracks and crack-like defects that have caused oil and gas pipeline failures. The software incorporates statistical distributions of all important parameters in a pipeline fracture mechanics calculation that uses a Monte Carlo analysis algorithm that randomly samples from each distribution and runs millions of simulations to estimate the probability of rupture versus time. To evaluate the impact of hydrogen blending, Synthesis has been adapted to incorporate the effects of hydrogen on pipeline steel properties (enhanced FCG and hydrogen embrittlement) and thus the ability to compare PORs with and without hydrogen blending. The modified software was then applied to several pipelines in the operator’s system to determine the POR ratio between various hydrogen blend levels and pure natural gas. Additionally, Synthesis can evaluate the effects of various mitigation measures, such as hydrotests and In-Line Inspections, that could be applied before injecting hydrogen (Figure 3). The calculated PORRs will allow the operator to prioritize pipelines and associated mitigating actions that may be more or less favorable for hydrogen blending.
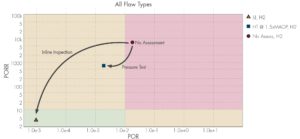
Figure 3. Improvement in POR and PORR for different integrity assessments.
APTITUDE™ JOIN INDUSTRY PROJECT
SI has also established a JIP to adapt the APTITUDE PFP software program to handle some additional challenges presented with blending hydrogen with natural gas. Advancements include modifications that address enhanced FCG and hydrogen embrittlement. Further research to close gaps identified during the PIRT process is also being pursued through PRCI and other forums. Availability to join the JIP still exists, but space is limited – Please contact us if you would like to participate.


 BASIS FOR MONITORING

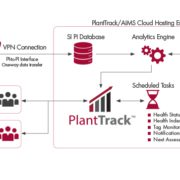
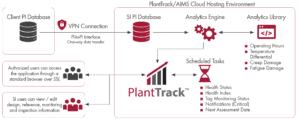


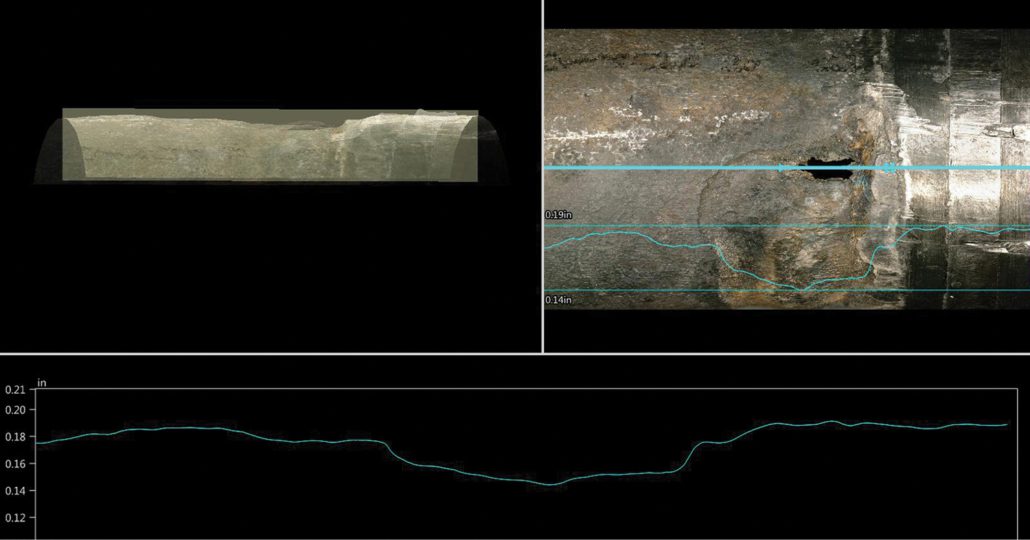

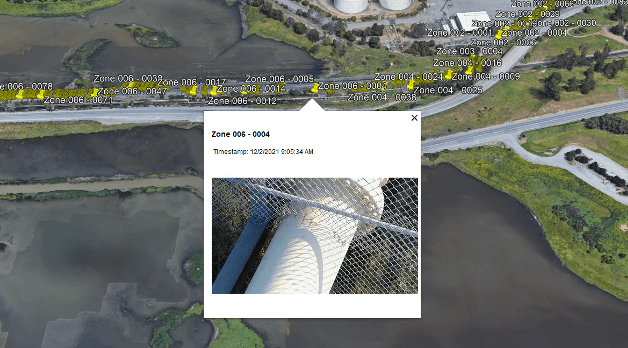
 Structural Integrity (SI) has recently added drones to our toolbox of inspection equipment. Using drones, inspectors are able to complete visual inspections safely and more efficiently. Applications of drones for visual inspections include plant and piping walkdowns, structural inspections and atmospheric corrosion monitoring (ACM) of exposed pipeline.


 With the reduction in staffing at power plants over the past 2 decades, many traditionally routine engineering and