Cathodic Protection for SLR: Lessons Learned from System Implementation
By: Curtis Strauss and Isaac Hall SI was engaged to design, install, and commission a
By: Curtis Strauss and Isaac Hall SI was engaged to design, install, and commission a
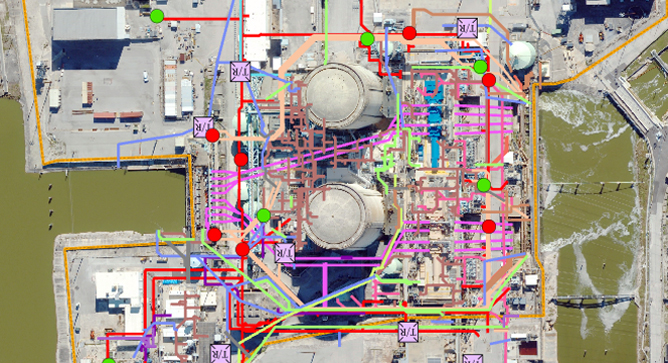
By: Wayne Gibson, Erica Libra-Sharkey, Warner Weber, and Al Jarvis In a nuclear power plant,

By: Clark McDonald, PhD Facilities that plan ahead for failure investigations are more likely to
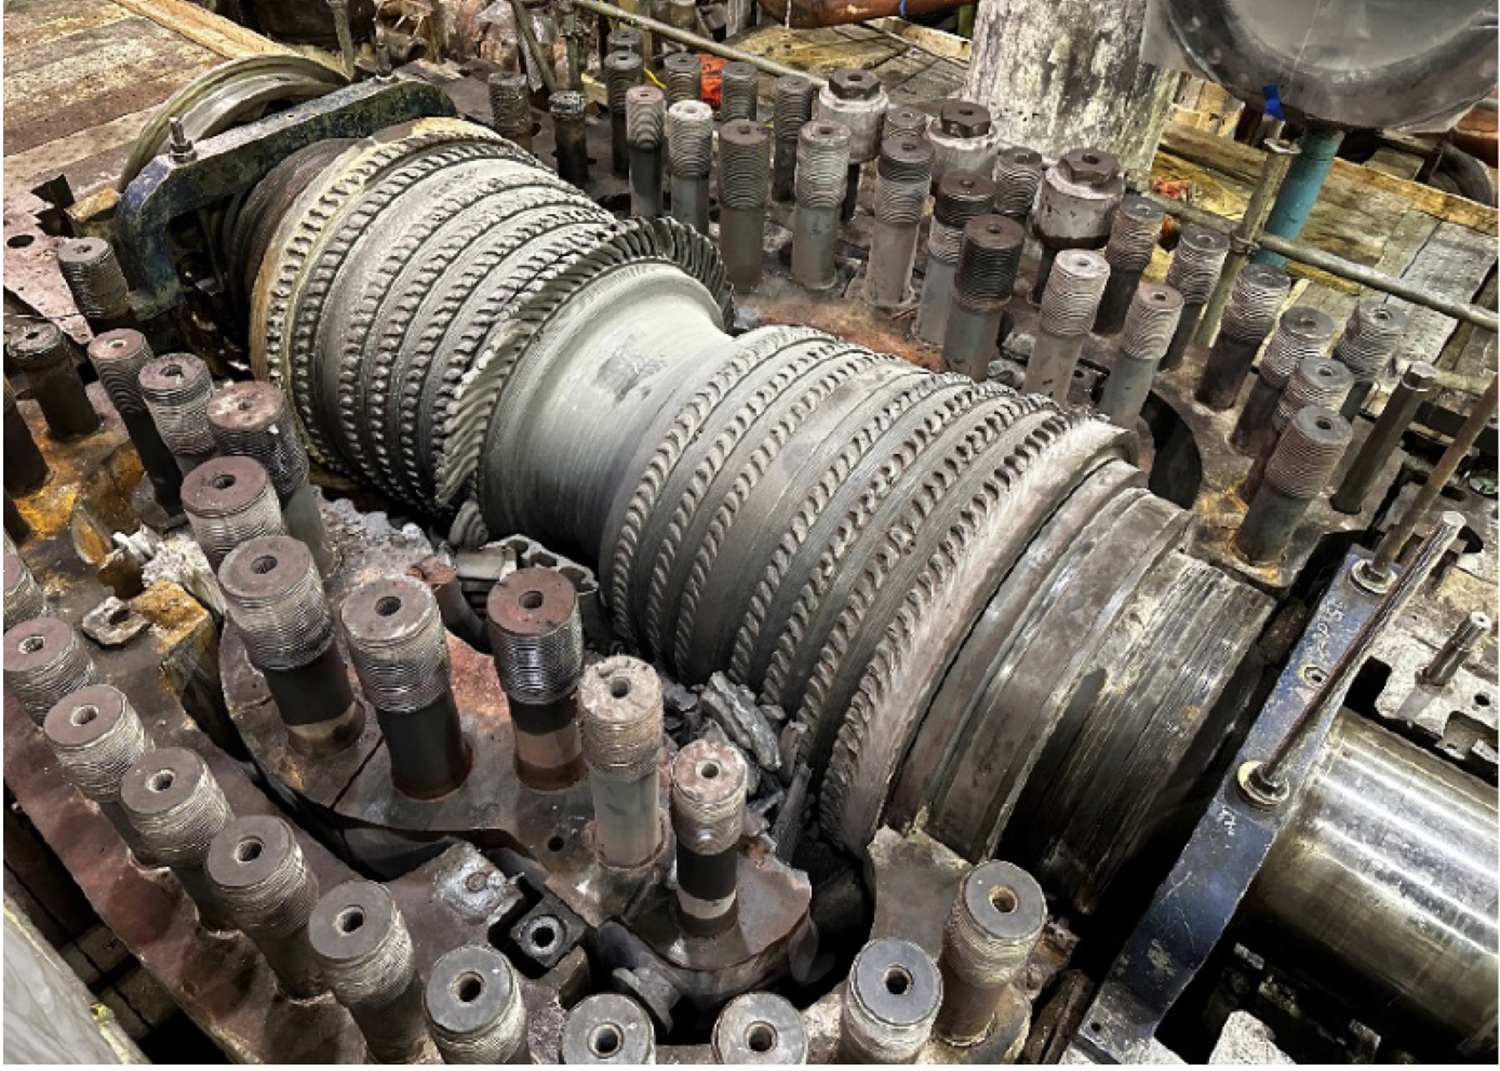
By: John Molloy and Dave King This article summarizes SIA’s independent root cause analysis of
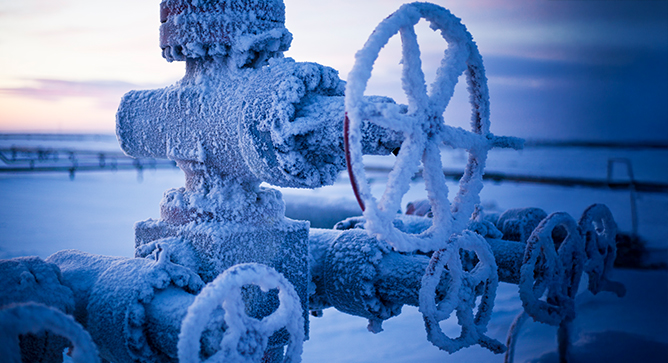
By: Elisa Yates and Matt McKinney This article details a significant winterization effort conducted by
By: Adam Roukema For nuclear power plants, service water (raw water) systems play a critical

By: Scott Riccardella, TJ Prewitt, Tyson Manning and Isaac Smith Aging pipeline infrastructure and past
Nuclear plant aging management programs require periodic inspections of liquid storage tanks. Traditional inspection methods

CREEP FATIGUE IN STEAM COOLED BOILER AND HRSG TUBES By: Wendy Weiss Creep-fatigue is caused
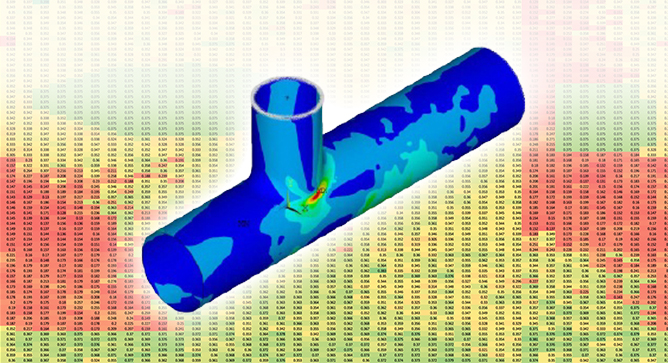
By: Julio Garcia, PhD, PE, Natalie Doulgerakis, PE, SE, Dan Parker, PE and Lachezar Handzhiyski