News and Views, Volume 54 | Advanced NDE for Hydroelectric Penstock Inspection
 By: Jason Van Velsor and Jeff Milligan
At SI, we regularly combine advanced NDE inspections with fitness for service evaluations to provide value-added solutions for our clients.
Hydroelectric power plants harness two of the most powerful forces on earth, water and gravity. The integrity of the penstocks that flow water to and away from the turbines in these plants is paramount to safe operation and the safety of the surrounding population. With many hydro plants approaching 100 years of service, critical issues can arise with these penstocks, which may have little to no fabrication documentation, may have significant fabrication imperfections, and may have significant accumulated damage from the environment and many years of service.
Our talented, highly experienced NDE staff can complete in-depth hydroelectric penstock inspections for our clients, providing peace of mind that their assets are safe to continue operating long into the future.
Example of Inspections Completed By SI
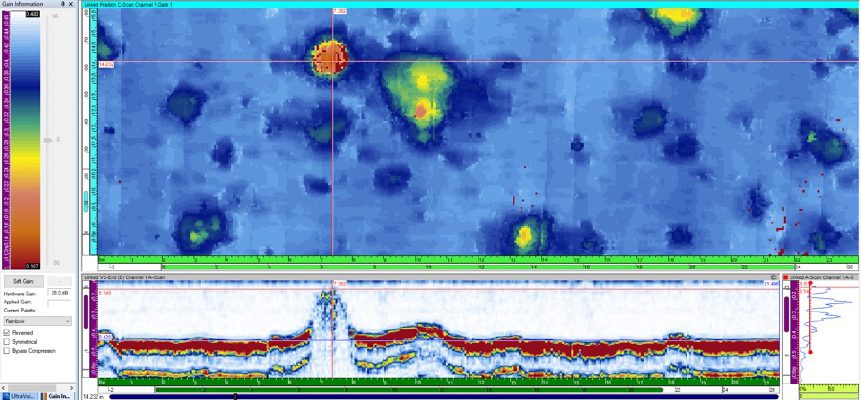
Figure 1. (Top) C-Scan image of corrosion spots on the ID of a penstock with the color scheme relative to material thickness; (Bottom) B-Scan image showing the thinnest thickness reading, 0.140 inch.
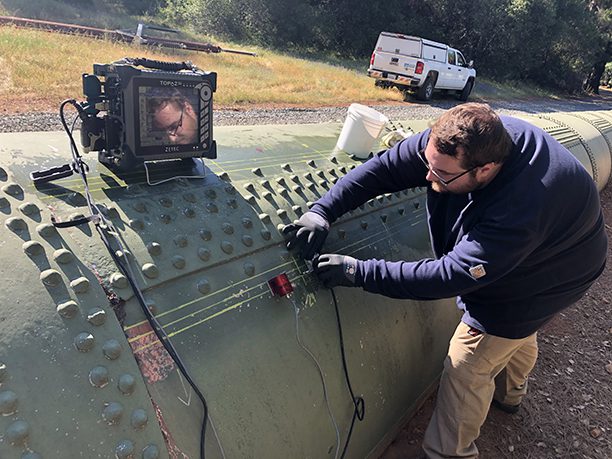
Phased Array Ultrasonic (PAUT) Corrosion Mapping of Penstocks
SI works with hydroelectric utility companies to provide detailed thickness measurements on specific areas of penstocks. Phased array ultrasonic corrosion mapping provides hundreds of thousands of thickness readings that can produce a detailed image of the inside surface of a penstock, which may have experienced corrosion or erosion that limits penstock life. This highly detailed scan produces the data required for accurate Fitness for Service (FFS) calculations. PAUT corrosion mapping can be performed from the outside diameter of penstocks that are above ground to detect internal wall thinning, or it can be performed from the inside of a penstock, as long as safe access and confined space requirements are met. An example of the phased array ultrasonic data can be seen in Figure 1 Thickness measurement values, often taken every 0.04 inch (1 mm) along the scan area can be saved and exported using industry standard formats (e.g., CSV, excel, etc.) to support further statistical analysis of the ultrasonic data.
Corrosion Surface Profilometry
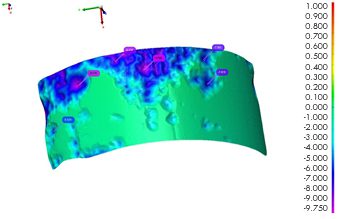
Figure 2. Laser scan image of corrosion on the OD of a penstock with pit depths identified.
For a pitted or corroded surface that is accessible to an inspector (ID or OD), the use of a laser profilometry device can be a valuable tool to map and depth size corrosion. Conventional pit gauge measurement of corrosion on penstock surfaces can be a time consuming and inaccurate process. The results rely heavily on the experience of the technician as well as the surrounding surface condition. A more efficient and accurate method is to create an exact image of the surface using a handheld laser scanner. The laser scanning process is very fast and the results can be displayed as a 3D surface or unrolled to a 2D view. Reconstruction of the surface is real-time, with color coding used to provide a visual relevance for material loss. Off-line analysis can be used to make discrete readings of wall loss, or the full map data file can be exported using standard file formats to allow other subsequent analysis to be conducted.
Short Range Guided Wave Technique to Inspect Riveted Joints for Crevice Corrosion
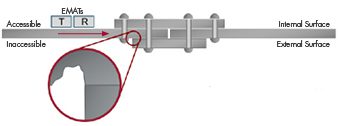
Figure 3. Drawing of potential location for crevice corrosion on a riveted lap-joint.
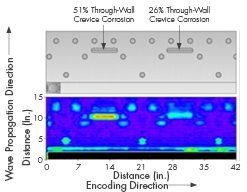
Figure 4. Mock-up drawing and actual examination data from SR-GWT test.
Some penstocks with riveted joints may suffer from crevice corrosion due to the construction geometry of the riveted lap joints. The lap-joint area is generally covered in concrete and buried so the external surface is not easily accessible. The concrete can disbond over time and water collects and runs along the crevice of the plate and butt strap, causing corrosion. The area of crevice corrosion may not be assessed from the internal surface with traditional ultrasonic methods due to the obstruction from the internal butt strap, therefore SI has developed a short range guided wave testing (SR-GWT) technique to inspect for this crevice corrosion. Figure 3 shows an image to help visualize the issue. For this technique electromagnetic acoustic transducers (EMAT) are utilized to propagate sound waves along the volume of the penstock plate to detect a change in the cross-sectional area. Figure 4 shows an example of inspection data that was collected on a calibration plate to prove this technique.
Lap-Welded Longitudinal Seam Inspection
Our staff can complete lap-welded seam identification and inspections. Lap-welded or forge-weld longitudinal seam pipes and penstocks were manufactured in the 1920s (Figure 5). Oftentimes, little to no fabrication documentation exists that will tell a hydroelectric utility if their penstock cans were made with lap-welded seams. SI developed a phased array ultrasonic examination technique to identify areas of lap-welded seams and look for lack of fusion and service damage.
SI developed two different PAUT techniques to identify and examine lap-welded penstocks. A refracted shear wave technique is preferred for ID-connected indications, while a longitudinal wave technique produces sound that is more perpendicular to the weld bond line of the lap-welded joint. Figure 6 shows PAUT scan data along with an explanation of typical features from three different lap-welded seam examinations.
ID/OD Girth Weld Inspection
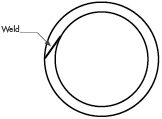
Figure 5. Illustrated cross-section of a lap weld.
Phased array ultrasonic examination of girth welds is also a common inspection for hydro penstocks. SI’s vast experience inspecting high energy piping systems and pressure vessels translate perfectly to penstock girth weld applications. SI uses ultrasonic software simulation programs to create scan plans that calculate the necessary beam angles and focusing to ensure 100% weld coverage during a PAUT examination. Encoding PAUT data with an automated, semi-automated, or manual encoding device allows for off-line analysis and a permanent record of inspection data. SI also has the ability to create custom scanners, probes, and wedges, when required for difficult inspection applications. The advanced NDE equipment and experience of SI is unmatched.

Figure 6. PAUT scans at 0° incidence (image is analogous to a cross-section of the weld) from hammer-welded pipe showing seam indications (labelled “1”) increased wall thickness at the seam (labelled “2”), and relatively clean areas adjacent to the seam (labelled “3”). The top image and center images show indications from the bond line (likely indicating lack-of-fusion), while the bottom image shows no indications from the bond line. Note that the base material on the left and right ends of the image shows dense areas of small indications, likely attributable to numerous impurities and inclusions in low-quality skelp from which this pipe was manufactured.
SI Can Help
The situations discussed previously demonstrate solutions that SI has developed for hydroelectric penstocks. With our extensive expertise, SI can work with our clients to develop and execute inspection solutions that are customized to their specific needs and provide various engineering analyses based on the examination results.